Free Access
Figure 3
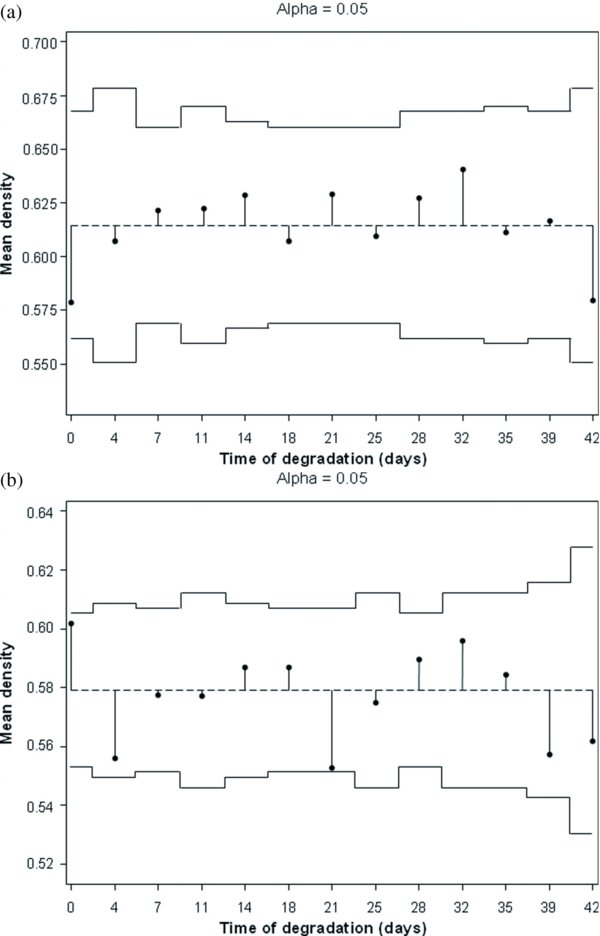
Statistical comparison of the mean initial density of samples (the dotted line represents the global mean; continuous lines represent the number of samples and circles represent mean values for each level of comparison. Mean values that are between continuous lines are equivalent); (a) for maritime pine; (b) for Douglas fir.