Free Access
Figure 4
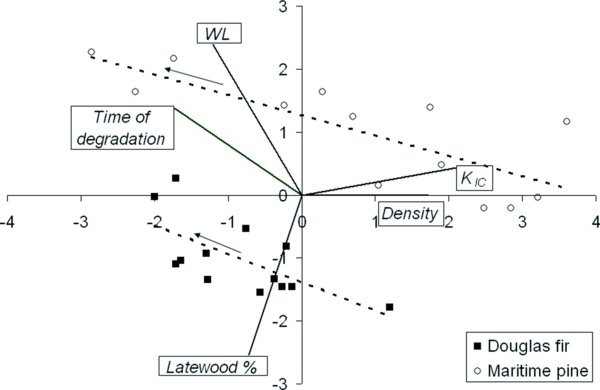
Principal component analysis of all measured variables (each point is the mean value of 12 replicates); solid lines indicate the weight of each variable in the normalised 1,2 plane. Dotted lines and arrows indicate the trends of decay progression for both species.