Free Access
Figure 1
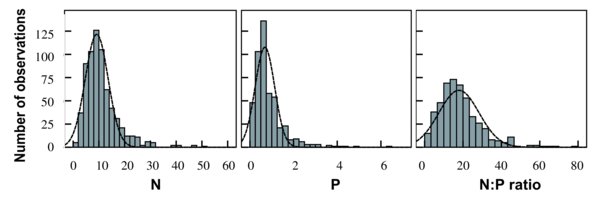
The distribution of leaf-litter N concentration, P concentration and N:P ratio for woody plants at a global scale (data in Appendix S1). The dashed curves in the figures indicate fitted log-normal curves.