| Issue |
Ann. For. Sci.
Volume 67, Number 8, December 2010
|
|
|---|---|---|
| Article Number | 812 | |
| Number of page(s) | 11 | |
| Section | Original articles | |
| DOI | https://doi.org/10.1051/forest/2010048 | |
| Published online | 28 October 2010 | |
Original article
Phenotypic plasticity in Pinus pinaster δ13C: environment modulates genetic variation
Unidad de Recursos Forestales, C.I.T.A., Avda de Montañana 930, 50059 Zaragoza, Spain
* Corresponding author: lcorcuera@aragon.es
Received: 16 December 2009
Accepted: 10 March 2010
• Carbon isotope composition (δ13C) is a complex trait involved in acclimation, adaptive processes and related to water use efficiency (WUE) and/or productivity.
• To estimate the genetic variation in δ13C and growth (h), their relationship, and the genotype by environment interaction effect in both variables, we analyzed three Pinus pinaster populations and six to ten families per population, in two experimental trial sites and in two consecutive years.
• δ13C increased in the drier site (from –27.15 ± 0.18 to –24.53 ± 0.22) and was more affected by environment (62% of variance) than by genotype.
• All populations and families exhibited a high phenotypic plasticity in δ13C and increased WUE in the xeric site.
• As expected, significant height differences between sites, years, populations and families were displayed. Smaller trees were associated to higher water use efficiency (δ13C) in both, mesic and xeric trial sites.
• Aridity and continentality enhanced population differences in δ13C, therefore, in afforestation programs of arid and continental zones, the selection at the population level would be more efficient than at the family level. In the mesic site, the presence of a high genetic variation in δ13C and h between families allows the possibility of a selection for growth and water use efficiency within populations in sub-humid sites.
Key words: carbon isotope / phenotypic plasticity / genetic variation / environmental interaction / water use efficiency
© INRA, EDP Sciences, 2010
1. Introduction
The Mediterranean conifer Pinus pinaster Ait. grows under contrasting water availabilities: from oceanic (south France) to arid conditions (south Spain and north Africa) and expands over more than 4 million ha. The species displays a high level of population differentiation and plasticity throughout its natural geographical distribution in growth (Alia et al., 1995) and physiological parameters related to drought resistance (Fernandez et al., 1999).
Plant drought responses involve many drought-related traits. Stomatal regulation plays a key role when water vapor pressure increases, but results in lower photosynthetic rates. Intrinsic water-use efficiency (WUE) or the ratio of total dry matter production to the total amount of transpiration during a certain carbon fixation period (Fischer and Turner, 1978), is a complex trait sometimes associated to the superior performance of genotypes in drought-prone environments (Sun et al., 1996), although there are evidences of the contrary (Guehl et al., 1995, Lauteri et al., 1997). WUE in maritime pine may vary with both, the environment (Nguyen-Queyrens et al., 1998) and the genetics of the species (Brendel et al., 2002).
Measurements of WUE have been simplified by the discovery of a strong and positive correlation between WUE and stable carbon isotope composition (δ13C). δ13C shows discrimination against the heavy isotope of CO2 (C13O2) during photosynthesis, and is negatively correlated with intercellular CO2 concentration (Ci) and stable carbon isotope discrimination (δ, Farquhar et al., 1989). δ is the ratio (δa – δp)/(1−δp), where δp is the isotopic composition of the plant material and δa is that of the air. In P. pinaster it was validated that δ13C may be used as a surrogate for WUE (Fernandez et al., 2006), is linked to other hydraulic traits in Pinaceae (Martinez-Villalta et al., 2004) and might have higher heritability than other measures of WUE (McKay et al., 2003). On the other hand, the trait shows a remarkable environmental influence, and consequently needs to be tested in a wide range of environments with a rigorous environmental control, and the complexity of the trait, which involve several functional candidate gene types, might complicate validation of genotype/phenotype associations for WUE (Gonzalez et al., 2008).
Adaptive responses to environmental changes depend on species (Zhang and Cregg, 1996). A lack of population differentiation in physiological traits like net photosynthesis (A), stomatal conductance (g) and δ indicates genetic stability in these characters and a high level of plasticity of gas exchange (Zhang and Marshall, 1995). It supports physiological plasticity as the primary mechanism that allows species to grow in a range of environments. However, population differences in δ provided evidence of genotypic differences between populations in P. pinaster (Nguyen-Queyrens et al., 1998). In seasonally dry climates, P. pinaster foliar δ13C can be used as a drought stress indicator due to its strong correlation with predawn water potential (Warren et al., 2001). For the application of carbon isotope indexes in selection programs, it would be appropriate to obtain a relationship between variation in δ13C and growth on the field, in order to use δ13C as a surrogate for WUE and improve WUE or/and productivity. Intraspecific variability in growth traits (Harfouche, 2003), δ13C, and their relationship (Aranda et al., 2010) have been previously reported in Pinus pinaster.
A high WUE is the result of the stomatal conductance regulation via a high net photosynthesis, a low transpiration, or both (Faquhar et al., 1989). Then, growth and δ13C may be positively, negatively, or no correlated, depending on the main physiological process regulating stomatal performance. If variation in discrimination is primarily controlled by differences in carboxilation efficiency rather than stomatal conductance (Flanagan and Johnsen, 1995), a strong and negative genetic correlation between δ and growth indicates that photosynthetic differences are the main factor of genetic variation in δ.
Johnson et al. (1999) observed a high δ heritability and lower environmental sensitiveness than growth and suggested δ as a suitable trait for indirect selection in Picea mariana families. However, in P. pinaster, a significant but moderate heritability was found for δ13C and ring width and the phenotypic correlation between them was attributable to environmental components (Brendel et al., 2002). This was corroborated by Aranda et al. (2010), who also found phenotypic plasticity in δ in response to different drought-stress levels in P. pinaster seedlings at the population and family level. In addition, the relationship between δ13C and growth depends on environmental conditions. A negative correlation between δ and growth was found in Picea mariana families on a dry site, while no significant correlation was observed on sites where water availability was higher (Flanagan and Johnsen, 1995). In P. pinaster provenance trials with high precipitation regimes, no correlation (Nguyen-Queyrens et al., 1998) or a negative correlation between growth performances and δ values were found for all provenances in one of several trial sites (Tognetti et al., 2000). In a single trial site, the relationship between δ13C and growth showed different patterns depending on the origin of the maritime pine populations. Low δ13C values were associated to low height in a Mediterranean population and to high height in the Atlantic populations (Correia et al., 2008).
Previous studies in P. pinaster obtained δ13C variation at a population level (Correia et al., 2008), family level (Fernandez et al., 2006), and both, population and family level (Aranda et al., 2010). We analyzed the intra-specific variability of δ13C at the inter- and intra- population levels. As environmental heterogeneity is attributed to differences in place and time, various locations and periods are necessary to get an estimate of spatial and temporal phenotypic plasticity and adaptive genetic variation in WUE (estimated by δ13C) and growth. We examined the environmental and genetic variation in several P. pinaster families from three populations, in two provenance-progeny trials that vary in productivity due to contrasting altitudes and precipitation regimes, during two consecutive years. Our objectives were: (i) to assess the variability in growth and δ13C at a population and family level, (ii) to investigate the relationship between δ13C and growth and (iii) to determine whether variation in δ13C was associated to the geographic variation in water availability of the seed sources (adaptation), (iv) or to the water availability in the trial sites (plasticity).
2. Materials and methods
2.1. Study site and plant material
The study was conducted during late summer of 2005 (2-year old plants) and 2006 (3-year old plants) in two maritime pine provenance-progeny tests. The trials were established using seedlings grown in nursery from open-pollinated seed collected in natural stands of maritime pine. Provenance progeny trials were located in Parderrubias, NW Spain, at a low elevation, near the Atlantic ocean, exposed to wet and mild winters (hereinafter, mesic site, Me) and Calcena, NE Spain, at an interior mid-high elevation, with a continental climate and colder and drier winters (hereinafter, xeric site, Xe). Both sites undergo summer drought (Fig. 1). Besides drought, other environmental factors could have influenced δ13C in maritime pine, like nutrient availability (Fernández et al., 2006). However, soil fertility analysis revealed no differences between sites.
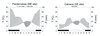 |
Figure 1 Climate in the study area according to the ombrothermogram of the nearby Allariz (A) and Aranda de Moncayo (B) meteorological stations. Precipitation information: dotted area, precipitation < 2 temperature (dry period); striped area, precipitation > 2 temperature (humid season). Temperature information at bottom: lower black block, period with probable frost (absolute monthly minimum temperature ≤ 0 °C and mean minimum temperature of the coldest month ≥ 0 °C); lower white block, frost-free months, i.e. mean minimum temperature of the coldest month ≥ 0 °C. |
In site Me two-year old seedlings were planted in 2005 at a spacing of 3 m × 2 m in a randomized complete block design with 4 replications of 71 blocks, 225 families, 4 plants per experimental unit (a total of 16 plants per family). In site Xe one-year old seedlings were planted in 2004 at a spacing of 2 m × 3 m in an α-lattice incomplete block design with 3 replications of 65 blocks, 8 families by block and 4 plants by experimental unit. Both trials were designed in a nested structure of families within populations. The three populations were selected in order to cover a wide range of temperature, precipitation and altitude (Arenas de San Pedro (A), interior, central Spain; Oria (O), south-east coast of Spain; and Mimizan (M), south-west coast of France, Landes). Location and climatic data for the progeny trials and seed sources are presented in Table I.
Location and climatic data of the progeny trials and seed sources. P: Mean annual precipitation; T: Mean annual temperature; TM: Mean of maximum/mean temperature, in month with highest mean; Tm: Mean of minimum/mean temperature, in month with lowest mean. Xe: xeric, Me: mesic.
Sampling: selection of populations, number of families per population and individuals per family were performed depending on the availability of plant material at Xe site, due to low survival. Number of families: A (10), O (8) and M (6). In Me, due to the high percentage of survival (close to 100%), we selected 10 families per population at random, having preference for the families sampled at Xe. From 4 to 8 individuals within families were measured in both sites.
2.2. Carbon isotope discrimination
Needle samples were collected at both provenance-progeny trials at the end of September 2005 (1st year of measurements) and September 2006 (2nd year of measurements) from the top one-third of the crown on each of the trees used for growth measurements. The samples were oven-dried at 70 °C for 72 h and finely ground to pass a 40-mesh screen. The abundance of stable isotopes of carbon in combusted samples were performed using a mass spectrometer at the Stable Isotope Lab, INSTAAR, University of Colorado, Boulder. Stable carbon isotope ratios were calculated as δ13C = Rsample/Rstandard−1, where R is the molar ratio of heavy to light isotope (13C/12C). All values were reported in per mil and relative to PDB, Pee Dee Belemnite limestone, the international standard (Craig, 1957).
2.3. Statistical analysis
Following the experimental design and assuming that the residuals were independent and normally distributed (0, Ve), the following model was established for both variables (h and δ13C):

yijklrbn is the value of the variable for the nth seedling from the jth family within ith population, measured the kth year at the lth site located in mth block within the nth replication;
μ is the overall mean of the variable;
pi is the effect of the ith population (i = 1−3);
fj(i) is the effect of the jth family (j = 1−10 max.) within the ith population;
yk is the effect of the kth year (k = 1−2);
sl is the effect of the lth population (l = 1−3);
η(rxl) is the effect of the mth-replication (k = 1−3,4);
βb(rxl) is the effect of nth block (b = 1−65 max) within mth replication; and
εijklrbn is the residual (n = 1−4,16 max).
The model was analyzed as a mixed model with fixed (population, family, year and site) and random (block, replication and error) effects, where the components of variance were obtained by restricted maximum likelihood (REML). The best linear unbiased estimators and predictors (BLUE and BLUP) for fixed and random factors, respectively, were obtained (SAS, 1999).
Pooled heritabilities (narrow sense) over populations, h2, were calculated for both variables after removing the population component.
 where: VP is the phenotypic variance, VA is the additive variance, Vfam is the family variance, Vrep is the replication variance, Vbl is the block variance and Ve is the error variance.
In order to plot the δ13C population expression in the four different environments tested in the experiment (2 sites × 2 years), we constructed a dummy index based on climatic data, absorbing as much variability as possible. The climatic variables used were precipitation (mean annual and monthly values) and temperature (mean annual values and mean of average, maximum and minimum monthly values), summing up 52 climatic variables. This climatic index was the first component obtained from a principal component analysis (PCA), which accounted for a 52.45% of the total variation (SAS, 1999).
A canonical discriminate analysis for height, diameter (d) and δ13C, was performed (proc CANDISC. SAS, 1999) and all the observations (means by population and family as grouping factors) on the two first canonical variables were obtained.
Pearson correlation coefficients were conducted to analyse the relationship between δ13C and growth.
Phenotypic variability was displayed by means of the coefficient of variation obtained from the phenotypic values. In the same way, for genetic variability, the coefficient of additive variance (defined as the ratio between additive variance and mean) was considered (Houle, 1992).
Genetic correlations could not be calculated accurately because the model was quite unbalanced, without enough degrees of freedom for useful estimations.
3. Results
3.1. Height
h varied significantly between sites, years, populations and families (P < 0.0001, Tab. IIA). Height differences between the populations from mesic (M and A) and xeric origins (O), were expressed in site Me, where M and A presented higher growth. In Xe, only A had a significant superior growth than O the 1st year (Tab. IIB, Figs. 2A, 2B). Population and most family means had higher h values in Me (Figs. 4B1, 4B2; published on line) and height differences between sites were higher for the mesic populations, M and A (Figs. 2A, 2B). Furthermore, height differences between Xe and Me in O were only displayed the 2nd year. The interaction Fam × site (P < 0.0001) was significant (Tab. IIA). Environmental conditions (site × year) absorbed a higher percentage of the variance than genotype (Tab. III). Population and family variation in h were higher in site Me (16.86–94.40 cm) than in Xe (14.00–44.29 cm; Tab. IV). In addition, population variation in Xe was only expressed the 1st year (Tab. IV). As a result, significant population differences in h were displayed the 1st year in Xe (Tab. IIB). Individual heritability pooled over population was 1.14 ± 0.27. This high value is due to the extraction of the population effect.
Summary of ANOVA significances. δ13C: isotope carbon composition; h: height. Num DF: numerator of degrees of freedom. Den DF: denominator of degrees of freedom. P: probability. F: F-values. Pop: population. Fam: family. Significant values in bold.
Summary of ANOVA significances by site and year (Xe/Me; 1st/2nd year). Abbreviations like in Table IIA.
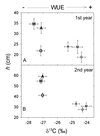 |
Figure 2 Representation of the carbon isotope composition (δ13C) vs. height (h). Population LS means the 1st (A) and 2nd years (B). Populations: Arenas (A), Oria (O) and Mimizan (M). Families per population in the xeric trial site, Xe: A (10), O (8) and M (6), and 10 families in the mesic trial site, Me (bold letters). Data are means ± standard errors. Higher values (less negative) are associated to higher water use efficiency. |
3.2. Carbon isotope composition
Significant differences in δ13C by sites (2.63‰ ± 0.12, P < 0.0001) were higher than by years (0.32‰ ± 0.12, P < 0.0001). Similar δ13C values were displayed in Me both years (difference of 0.26‰ ± 0.19 between years) and slightly different in Xe (difference of 0.63‰ ± 0.22 between years). Trees had higher water use efficiency in Xe both years. The G × E interaction was significant at a population (Pop × site) and family level (Fam (Pop) × site, Tab. IIA). Environmental conditions (site × year) absorbed the highest proportion of variance for δ13C (62%, Tab. III). There was higher δ13C variation at the family level than at the population level (Tab. III). Genetic variation in δ13C was displayed at the population level in Xe and at the family level in Me (Tab. IIB). As a result, δ13C family variation was higher in site Me and there was no population variation in Me (Tab. IV). Individual heritability pooled over population was 0.66 ± 0.25.
The three populations displayed higher δ13C values (less negative, higher WUE) in site Xe (Fig. 3). Population variation was 1.26‰ ± 0.30 in Xe and 0.60‰ ± 0.28 in Me (Fig. 2A, 2B). Families varied 3.95‰ ± 0.92 in Me and 1.85‰ ± 0.66 in Xe (data not shown). There was a significant population/family by site interaction (Tab. IIA). In Xe, A showed lower WUE than M and O the 1st year and lower than M the 2nd year (Fig. 2) and differences between families emerged in Me (Tab. IIB). There was a high, positive and significant correlation among δ13C family values in consecutive years in both sites (R2 = 0.79, P < 0.05; data not shown).
Percentages of variance. Abbreviations like in Table II.
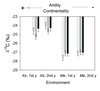 |
Figure 3 Representation of the δ13C population means and standard errors across environments (Me: mesic trial site, Xe: xeric trial site, 1st y: first year, 2nd y: second year). M: white bars, A: grey bars, O: black bars. Division of X axis obtained from a PCA integrating precipitation and temperature values. Climate close to the origin of the X axis is drier, with more extreme maximum and minimum temperatures and becomes milder and wetter along the axis. Precipitation and mean of maximum and minimum temperature values of the hottest and coldest month, respectively: Xe, 1st year: 323 mm, 32.03 °C, –1.11 °C; Xe, 2nd year: 488 mm, 30.9 °C, 0.41 °C; Me, 1st year: 704 mm, 28.5 °C, 1.04 °C; Me, 2nd year: 969 mm, 26.7 °C, 2.1 °C. |
δ13C mean population and mean family values from a subsample of the families present in both progeny trials were plotted in a bi-directional graph (Me vs. Xe, Figs. 4A1, 4A2; published on line). Populations and most families showed a high level of plasticity (away from the diagonal line) and displayed higher δ13C values in Xe. Populations showed genetic differentiation for plasticity and a G × E interaction (Fig. 3). The climatic index of the PCA arranged environmental conditions in a way that climate close to the origin of the X axis was more extreme (in terms of temperatures, i.e., continentality) and drier and became milder and wetter along the axis. Population differentiation in δ13C increased with aridity and continentality.
3.3. Relationship between δ13 C and growth
When environmental effects were removed, i.e., studying the relationship between h and δ13 C corrected by their environment, no correlation appeared (R2 = −0.03, P = 0.426). In a global model including the 4 conditions (2 sites, 2 years), there was a negative phenotypic correlation between h and δ13C from all the individual values (R2 = −0.23, P < 0.0001), individual values by year of measurements (1st year: R2 = −0.32, P < 0.0001; 2nd year: R2 = −0.28, P < 0.0001), individual values from each population (A: R2 = −0.24, P = 0.0013; O: R2 = −0.18, P = 0.0175; M: R2 = −0.31, P = 0.0003), mean family values (1st year: R2 = −0.26, P < 0.01; 2nd year: R2 = −0.46, P < 0.01) and mean population values (R2 = −0.65, P < 0.01; excluding the O population growing at Me, data not shown). h and d displayed a strong and positive correlation (R2 = 0.8076, P < 0.0001), then, there was a trend in higher and more vigorous plants having lower δ13C values (more negative, lower WUE) and vice versa. However, in populations or families growing under the same environmental conditions, that is, in every site and year, there was no trend. In general, taller populations or families, did not showed lower δ13C values, except for the A and O populations in the xeric site (Fig. 2A), A families in the mesic site (R2 = −0.63, P = 0.0061; data not shown) and M families in the xeric site (R2 = −0.81, P = 0.0058; data not shown).
A canonical discriminant analysis based on height, diameter (d) and δ13C, and population and family as grouping factors, showed that in Xe the variance split among δ13C and growth the 1st year (drier). δ13C absorbed the 66% of the variation in axis 1 (R2 = 0.12, P = 0.0003) and h and d the 34% in axis 2 (R2 = 0.07, P = 0.0061). Only in this case, in the drier situation, δ13C had a greater effect on population and family variation than growing characters. The 2nd year, the variation of physiological and growth parameters was displayed in a single axis in the xeric site (90% of variation, R2 = 0.15, P = 0.0005). In Me, δ13C, h, and d accounted for the 96% (R2 = 0.26, P < 0.0001) and 98% (R2 = 0.15, P = 0.0004) of the variation in a single axis, both years (data not shown).
4. Discussion
4.1. Growth
In our study, population differences in height were related to drought adaptation. In maritime pine low growth is associated to populations from dry climates and vice versa (Nguyen-Queyrens et al., 1998). The superior height of the A population and a population from the French Landes versus O was previously reported in seedlings (Fernandez et al., 1999). Natural selection might have favored trees which limit water loss in drier habitats and fast growing and more competitive trees in rainy areas. The limiting conditions for growth in the xeric site shaped only slight height differences between the A and O populations the 1st year.
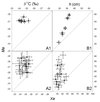 |
Figure 4 Bi-directional population LS means ± standard errors for carbon isotope composition (δ13C, A1) and height (h, B1) in the 2 trial sites (axis X: Xe, axis Y: Me). Symbols: Arenas (A), Oria (O) and Mimizan (M) the 1st year. Bold letters the 2nd year. Bi-directional LS means ± standard errors for δ13C (A2) and h (B2) in a subsample of families present in both progeny trial sites. Symbols: ●, 1st year; ◯ , 2nd year. Diagonal lines represent equal values in both sites. |
The site had a significant effect on growth. Trees grown in the mesic trial site had higher height and diameter. Growth restrictions in response to soil drought were presumed and previously reported in P. pinaster (Nguyen-Queyrens et al., 2002). Populations from more mesic origins (M and A) displayed plasticity in growth and increased height in more favorable environmental conditions, i.e., in the mesic site. However, O, original from South Spain, with high xericity, showed small growth differences between the mesic and xeric trial sites. This agrees with Guyon and Kremer (1982), who observed that a provenance from Morocco showed a reduced physiological activity and high growth stability in all the locations tested and the Atlantic populations reacted quickly to the interannual and spatial climatic variability. As a result of the growth reduction by the mesic populations there seems to be a convergence in size in the xeric site.
There was no interaction between genotype and ambient (year or site) at the population level in h. Thus, the ranking of the provenances was similar in both sites and years. The lack of population × year interaction is in accordance with Danjon (1994) who found a stable ranking of the P. pinaster populations for height across years. The absence of a population × site interaction agrees with Chambel et al. (2007) who found a non significant population × treatment interaction in P. pinaster seedlings in response to drought stress.
We also found significant differences in h between families and a family × site interaction, indicating adaptation and plasticity to water availability within populations. This results agree with Zas et al. (2004) and Zas and Fernandez-Lopez (2005) who found a family × site interaction in growth of P. pinaster adult trees and a family × water availability interaction in P. pinaster seedlings, respectively.
4.2. Carbon isotope composition
4.2.1. Inter- and intra-population variation in δ13C
δ13C variation between our populations was 1.26‰ in the xeric site and 0.60‰ in the mesic site, which is in the range of previous P. pinaster observations (Correia et al., 2008). As a result, we only found δ13C differentiation of populations in the xeric site (Tab. IIB), which suggests that the WUE was affected by both, external and internal factors, like water availability and gas exchange performance, or by their interaction. Higher δ13C variability in the drier trial site was also observed by Voltas et al. (2008) in Pinus halepensis populations.
In Xe, the A population presented lower WUE than M and O the 1st year and lower WUE than M the 2nd year. This result could be expected for O, from a dry origin. However, M, from the French Landes, has proved to be as much drought resistant as O in the mesic trial site and has shown a great plasticity, been even more drought resistant than O in the xeric trial site, from the results obtained in the vulnerability curves to cavitation (unpublished data). Despite the mean annual precipitation of the geographic origin of M is high, the location is very windy, which could cause high vapor pressure deficit around the needles, and the soils are sandy with low water retention. These environmental factors could have played a role in the drought resistance displayed by M. Furthermore, in a previous study, the population from the French Landes exhibited the highest δ13C among one Mediterranean and six Atlantic P. pinaster populations (Correia et al., 2008). They explained the higher WUE of the Landes population by its adaptive evolution. It originates in the northern range of the species, exposed to cold winters, less severe summer droughts, and shorter growing seasons and could initiate stomatal closure at lower water deficits, leading to inferior discrimination and higher δ13C.
The ranking of the populations A and M in δ13C was maintained from the 1st to the 2nd year, but this was not the case for O, which showed intermediate values among the other populations the 2nd year. It is not surprising that despite the high heritability of δ13C the ranking of populations differed through years. By definition, heritability is a ratio between variances affected by the environmental conditions. Aridity and continentality changed from year 1 to year 2 (Fig. 3), and therefore, the ranking of populations might vary.
The lack of δ13C population differentiation in the mesic site is in agreement with Tognetti et al. (2000) who tested P. pinaster populations in experimental trials of high annual precipitation and different altitudes. Correia et al. (2008) observed minor but significant δ13C differences between populations in a subhumid trial site. However, the populations from the driest and more humid origins displayed equal δ13C values, which is in agreement with our results in the mesic trial site. Absence or small population variation might indicate population convergence when these populations grow in a stress-free environment. Populations from drier and lower latitudes did not exhibit higher water use efficiency compared to northern and humid latitudes. This could be related to and absence of differences in gas exchange rates (A and g), which was reported for the A and O populations and another population from the French Landes, in two water treatments, by Fernandez et al. (2000). In any case, δ13C is a physiological response affected by many others characters than stomatal control and photosynthetic capacity, like leaf area, nitrogen content, phenology, carbon allocation, root characteristics and hydraulic properties. Then, variations in other species-specific traits could have balanced to keep WUE at a constant rank.
In the mesic site, P. pinaster δ13C variation was partitioned within populations, which is in accordance with Fernandez et al. (2006) who found a larger P. pinaster family variation in the more favorable water treatment. The significant genetic variation at the family level was consistent with the results of Brendel et al. (2002) and suggests the existence of genetic adaptive variation upon which the process of natural selection could act and the achievement of additional gains in δ13C by family selection. Fernandez et al. (2006) did not obtained δ13C differences among P. pinaster families grown in a greenhouse, which was associated to the low water stress reached at the experiment (60% and 50% of field capacity in control and water stress treatments, respectively). Phenotypic response in δ13C is largely influenced by environmental conditions (62% of variance, Tab. IV, Brendel et al., 2002). Nevertheless, we obtained significant δ13C differences, in both control and water stress treatments, in P. pinaster populations and families grown in a greenhouse (unpublished data).
The more favorable environmental conditions in the mesic site allowed the differentiation of δ13C at a family level but the extreme environmental conditions in the xeric site enhanced minor δ13C population divergences. This could be interpreted as a consequence of the low- and high- differentiation between- and within- populations, respectively, found with nuclear and cytoplasmic markers in maritime pine (Ribeiro et al., 2001).
4.2.2. Relationship between δ13C and environmental conditions
In general, populations and families presented much higher δ13C mean values in the xeric site. The higher water use efficiency of trees in the more xeric trial site is in agreement with the well-known effect that, in a global scale, δ13C increases with increasing evaporative demand/water limitation (Ehleringer et al., 2002). Particularly, in the case of P. pinaster, an increase in δ13C with water stress has already been reported by several authors at the species (Warren et al., 2001) and population level (Nguyen-Queyrens et al., 1998). On the contrary, Porte and Lostau (2001) found an inverse relationship between latewood δ13C and soil water availability. The positive relationship between WUE and water stress in P. pinaster is associated to a high stomata control in detriment of net carbon assimilation rate under drought conditions. Decreasing water potential caused the ratio A/g to increase (Picon et al., 1996), such that a reduction in soil water potential from –0.4 to −0.8 MPa produced an 80% loss of stomatal conductance in maritime pine (Loustau et al., 1990).
There was a clear environmental influence on carbon isotope composition, as demonstrated by the significant differences between sites and years for the δ13C values. This is in agreement with Tognetti et al. (2000) who studied five P. pinaster populations in four trial sites. We found important site differences in δ13C (2.63‰ ± 0.11), higher than the ones observed by Aranda et al. (2010, 0.82‰ ± 1.00) in P. pinaster seedlings subjected to a water stress treatment in which the substrate was kept at 40% of the saturation level. In the present study, the location of the trial site had a greater influence on δ13C than the year of measurements, i.e., differences by sites were more important than the interannual variation of climatic factors. This across-year stability of δ13C despite the between-year variation in environmental conditions is in agreement with previous works and indicates that the ranking of individuals in δ13C remained almost constant between years (Pennington et al., 1999). In maritime pine the relationship between δ13C values in consecutive years could be related to the use of carbon stocks from the previous year as a carbon source in spring (Porte and Lostau, 2001).
Despite the precipitation in the mesic site the drier year (704 mm), approached the rainfall in the xeric site the wetter year (488 mm), there was not a differentiation between populations in the mesic conditions. This indicates that, in addition to precipitation, other parameters like water availability in the soil (influenced by the soil type/structure) and/or the air relative humidity (R.H.) could play an important role in stomatal closure (66–67% in Me and 54–55% in Xe, mean R.H. during the growing season, spring+summer, in the 1st and 2nd year, respectively).
4.2.3. G × E interaction
We tested the genotype by environment interaction under two approaches (site and year) and two levels (population and family). While year had a significant effect on δ13C, the genotype × year interaction was non significant. This is consistent with the results of Cregg et al. (2000) and Flanagan and Johnsen (1995), who found non significant interactions between genotypes and years of contrasting rainfall in Pinus ponderosa populations and Picea mariana families, respectively, and was interpreted as a lack of G × water stress interaction. In contrast to the absence of genotype × year interaction, we found a significant genotype × site interaction, that is, Pop × site and Fam (Pop) × site interactions, which implies differences in plasticity among populations and families. This was formerly noticed in P. pinaster populations (Tognetti et al., 2000) and families (Aranda et al., 2010; Fernandez et al., 2006). In our study all populations and families presented higher WUE in the drier site.
The significant, but minor, differences in WUE between populations in Xe could be related to the high stomatal sensitivity to water stress of the species. Fan et al. (2008) observed that δ13C is highly dependant on the environmental conditions and obtained different rankings of redcedar populations under different environments and none relationship between WUE and origin of populations. There are also evidences of the contrary, δ13C decreased with summer dryness of the seed sources between ten Pinus contorta populations (Guy and Holowachuck, 2001).
Besides aridity, other environmental factors could have affected δ13C. Correia et al. (2008) found no association between δ13C and the precipitation of the place of origin in Pinus pinaster populations. However, δ13C variation was negatively correlated with the difference between the mean maximal temperature of the hottest month and the mean minimal temperature of the coldest month, that is, the continentality. Populations originating from colder climates could have adapted to shorter vegetative periods and showed earlier stomatal closure and less discrimination against 13C during the growing period, which led to higher WUE. We did not find evidences of that, as A originates from a continental site with colder winters and high differences between maximum and minimum temperatures and showed the lowest WUE in Xe.
We found high δ13C phenotypic plasticity and adaptation to the environmental conditions of the growing place, independently of the origin of populations. We did not found a lower responsiveness of δ13C to drought in O, the southern population from a dry origin, which disagree with Aranda et al. (2010), who noticed a different behavior among populations from wet and dry sites. Most of the families from wet provenances decreased δ in response to water stress, while the Moroccan population showed the same values and O a lower reduction in δ than the populations from mesic origins. In this work, all populations and families showed a higher WUE in the xeric site (Fig. 4, online). However, the genetic differentiation for plasticity was only found in the drier and continental location and the discrimination of the populations increased from the wettest and mildest to the driest and more continental situation along the X axis (Fig. 3). In fact, populations’ δ13C kept stable and non differentiated (canalization) in the two mild and wetter situations, but as conditions became more extreme, in terms of precipitation and temperatures (continentality), more differences were found between populations (plasticity).
4.3. Relationship between δ13 C and growth
Heritabilities for height and δ13C were significant, comparable with other values found in the literature for maritime pine (Danjon, 1994; Aranda et al., 2010) and imply the presence of considerable additive genetic variation and adequate control of environmental variation. We found a significant negative correlation between δ13C and h, i.e., smaller plants having higher WUE, which is consistent with previous works in P. pinaster populations (Correia et al., 2008). The opposite, a positive correlation between δ13C and growth, was observed in P. pinaster populations only in one site (Tognetti et al., 1997) and none relationship at all in other trial sites (Tognetti et al., 2000) or in P. pinaster families (Brendel et al., 2002). In the mesic site, growth differences between populations (higher growth in the mesic populations) did not lead to different δ13C. However, in the xeric site, small differences in h between A and O, led to significant differences in δ13C the 1st year (drier, Fig. 2A). On the contrary, A and M, having similar growth, displayed different δ13C values both years (Figs. 2A, 2B). At the family level, variation in growth was not accompanied by variation in δ13C in the xeric site, which agrees with Rowell et al. (2009) and suggests that growth differences were influenced by other mechanisms to cope with drought stress, instead of WUE. Nguyen-Queyrens et al. (1998) did not find a reliable correlation between δ13C and h in P. pinaster either. Higher trees displayed higher values of δ13C in 26 year-old trees but none relationship in 7 year-old trees, and the correlation at a population level was low (R2 = 0.08−0.16). In our case, the unclear relationship between δ13C and h at a population level could be related to the absence or low δ13C population variation displayed in the mesic and xeric site, respectively, and to the small number of populations tested. When combining the mean population values in the two sites a significant relation arose.
Differing relationship patterns between δ13C and growth have been explained as differences in the primary source for genetic differentiation in WUE. Genetic variation in δ13C is influenced by changes in photosynthetic capacity and/or stomatal conductance and is species-specific (Farquhar et al. 1989). In the case of P. pinaster, the species presents a drought avoiding strategy, with very high sensitivity of stomatal conductance to decreases in water potential, higher than the sensitivity of CO2 assimilation rate (Picon et al., 1996). If variation in carbon isotopic composition, and then, in WUE, is mainly caused by changes in stomatal conductance, higher δ13C and WUE values would lead to lower growth. This is consistent with the negative relationship between height and δ13C observed. The high stomatal sensitivity is an advantage under water stress but limits net carbon assimilation rate and biomass production. However, the lower WUE observed in trees from the more mesic trial site is advantageous for young establishing plants in natural stands where rainfall is relatively high as it was associated to higher growth. In addition to gas exchange performance, genetic differences in carbon allocation patterns should be taken into account when studying plant adaptations to water availability. On dry sites, with long periods of high evapotranspirative demand, a high stomatal control in order to reduce transpiration water losses and a greater carbon allocation to root growth in detriment of aboveground biomass, would lead to higher WUE in smaller trees. In fact, the seedlings of the O population showed a significant greater carbon allocation to roots than the other populations (unpublished data), which agrees with Guyon and Kremer (1982) and Aranda et al. (2010) who noticed that P. pinaster drought adapted ecotypes produced higher root to shoot biomass ratios.
5. Conclusions
Both, h and δ13C, were significantly influenced by the environment (site). The inter- and intra-population phenotypic plasticity observed in δ13C and h was mainly attributable to the environmental influence (62% and 37% of variance, respectively). P. pinaster populations and families of contrasting origins adapted to drought showed higher WUE (indicated by δ13C) and lower growth in the xeric site, confirming the adaptive potential of the species.
Phenotypic correlations appeared between tree growth and δ13C. There was a trend of smaller trees showing higher water use efficiencies, indicating a higher influence of stomatal control, rather than photosynthetic capacity, over δ13C and growth.
Population differences in h suggest adaptation to the environment of origin. Significant genetic variation in tree growth was also displayed at the family level. However, in the case of δ13C, aridity and continentality enhanced population differences and more favorable environmental conditions promoted family variation. Consequently, environment drove the genetic variation in such way that under stressful conditions differences in WUE among populations showed up but in a milder background the standard family variation was expressed instead.
The high influence of environmental conditions on δ13C and the minor population variation in stressful environments, point out an environmental control of δ13C compared with the genetic one. There is an aptitude for selecting maritime genotypes with higher WUE, based on carbon isotopic discrimination, but we have to take into account the effect of environment on δ13C. The superior δ13C variation found at a population level in the xeric site and at a family level in the mesic site, finger to a selection of populations in drier locations and families in sub-humid sites.
Acknowledgments
This work was supported by the INIA project: RTA2005-00131-00-00. We thank the anonymous referees and editor for their time and valuable comments.
References
- Alia R., Gil L., and Pardos J.A., 1995. Performance of 43 Pinus pinaster Ait. provenances on 5 Locations in Central Spain. Silvae Genet. 44: 75–81. [Google Scholar]
- Aranda I., Alia R., Ortega U., Dantas A.K., and Majada J., 2010. Intra-specific variability in biomass partitioning and carbon isotopic discrimination under moderate drought stress in seedlings from four Pinus pinaster populations. Tree Genet. Genomes 6: 169–178. [CrossRef] [Google Scholar]
- Brendel, O., Pot D., Plomion C., Rozenberg P., and Guehl J.M., 2002. Genetic parameters and QTL analysis of delta C-13 and ring width in maritime pine. Plant Cell Environ. 25: 945–953. [Google Scholar]
- Chambel M.R., Climent J., and Alia R., 2007. Divergence among species and populations of Mediterranean pines in biomass allocation of seedlings grown under two watering regimes. Ann. For. Sci. 64: 87–97. [CrossRef] [EDP Sciences] [Google Scholar]
- Correia I., Almeida M.H., Aguiar A., Alia R., Soares-David T., and Santos-Pereira J., 2008. Variations in growth, survival and carbon isotope composition (δ13C) among Pinus pinaster populations of different geographic origins. Tree Physiol. 28: 1545–1552. [PubMed] [Google Scholar]
- Craig H., 1957. Isotopic standards for carbon and oxygen and correction factors for mass-spectrometric analysis of carbon dioxide. Geochim. Acta 12: 133–149. [CrossRef] [Google Scholar]
- Cregg B.M., Olivas-Garcia J.M., and Hennessey T.C., 2000. Provenance variation in carbon isotope discrimination of mature ponderosa pine trees at two locations in the Great Plains. Can. J. For. Res. 30: 428–439. [CrossRef] [Google Scholar]
- Danjon F., 1994. Stand features and height growth in a 36-year-old maritime pine (Pinus pinaster Ait.) provenance test. Silvae Genet. 43: 52–62. [Google Scholar]
- Ehleringer J., Bowling D., Flanagan L., Fessenden J., Helliker B., Martinelli L., and Ometto J., 2002. Stable isotopes and carbon cycle processes in forests and grasslands. Plant Biol. 4: 181–189. [CrossRef] [Google Scholar]
- Fan S., Grossnickle S.C., and Russell J.H., 2008. Morphological and physiological variation in western redcedar (Thuja plicata) populations under contrasting soil water. Trees 22: 671-683 [CrossRef] [Google Scholar]
- Farquhar G.D., Ehleringer J.R., Hubick K.T., 1989. Carbon isotope discrimination and photosynthesis, Annu. Rev. Plant. Physiol. Plant. Mol. Biol. 40: 503–537. [Google Scholar]
- Fernandez M., Gil L., and Pardos, J.A., 1999. Response of Pinus pinaster Ait. provenances at early age to water supply. I. Water relation parameters. Ann. Sci. For. 56: 179–187. [CrossRef] [EDP Sciences] [Google Scholar]
- Fernandez M., Gil L., and Pardos J.A., 2000. Effects of water supply on gas exchange in Pinus pinaster Ait. provenances during their first growing season. Ann. For. Sci. 57: 9–16. [CrossRef] [EDP Sciences] [Google Scholar]
- Fernandez M, Novillo C., and Pardos J.A., 2006. Effects of water and nutrient availability in Pinus pinaster Ait. open pollinated families at an early age: growth, gas exchange and water relations. New For. 31: 321–342. [CrossRef] [Google Scholar]
- Fischer R.A. and Turner N.C., 1978. Plant productivity in the arid and semi-arid zone. Ann. Rev. Plant. Physiol. 29: 277–317. [CrossRef] [Google Scholar]
- Flanagan L.B. and Johnsen K.H., 1995. Genetic-variation in carbon isotope discrimination and its relationship to growth under field conditions in full-sib families of Picea mariana. Can. J. For. Res. 25: 39–47. [CrossRef] [Google Scholar]
- Guehl J.M., Fort C., and Ferhi A., 1995. Differential response of leaf conductance, carbon-isotope discrimination and water-use efficiency to nitrogen deficiency in maritime pine and pedunculate oak plants. New Phytol. 131: 149–157. [CrossRef] [Google Scholar]
- Guy R.D. and Holowachuk, D.L., 2001. Population differences in stable carbon isotope ratio of Pinus contorta Dougl. Ex Loud.: relationship to environment, climate of origin, and growth potential. Can. J. Bot. 79: 274–283. [CrossRef] [Google Scholar]
- Gonzalez-Martinez S.C., Huber D., Ersoz E., Davis J.M., and Neale D.B., 2008. Association genetics in Pinus taeda L. II. Carbon isotope discrimination. Heredity 101: 19–26. [Google Scholar]
- Guyon J.P. and Kremer A., 1982. Stabilité phénotypique de la croissance en hauteur et cinétique journalière de la presson de sève et de la transpiration chez le pin maritime (Pinus pinaster Ait.), Can. J. For. Res. 12: 936–946. [CrossRef] [Google Scholar]
- Harfouche A., 2003. Retrospective early test for adult vigor of Pinus pinaster families grown under two water regimes. Implications for early selection. Ann. For. Sci. 60: 539–547. [Google Scholar]
- Houle D., 1992. Comparing evolvability and variability of quantitative traits. Genetics 130: 195–204. [PubMed] [Google Scholar]
- Johnsen K.H., Flanagan L.B., Huber D.A., and Major. J.E., 1999. Genetic variation in growth, carbon isotope discrimination, and foliar N concentration in Picea mariana: analyses from a half-diallel mating design using field-grown trees. Can. J. For. Res. 29: 1727–1735. [CrossRef] [Google Scholar]
- Lauteri, M., Scartazza, A., Guido, C., and Brugnoli, E., 1997. Genetic variation in photosynthetic capacity, carbon isotope discrimination and mesophyll conductance in provenances of Castanea sativa adapted to different environments. Funct. Ecol. 11: 675–683. [CrossRef] [Google Scholar]
- Loustau D., Granier A., and El Hadj Moussa F., 1990. Évolution saisonnière du flux de sève dans un peuplement de pins maritimes. Ann. Sci. For. 21: 599–618. [CrossRef] [EDP Sciences] [Google Scholar]
- Mckay J.K., Richards J.H., and Mitchell-Olds T., 2003. Genetics of drought adaptation in Arabidopsis thaliana: I. Pleiotropy contributes to genetic correlations among ecological traits. Mol. Ecol. 12: 1137–1151. [Google Scholar]
- Martinez-Villalta J., Sala A., and Pinol J., 2004. The hydraulic architecture of Pinaceae – a review. Plant Ecol. 171: 3–13. [CrossRef] [Google Scholar]
- Nguyen-Queyrens A., Ferhi A., Loustau D., and Guehl J.M., 1998. Within-ring delta C-13 spatial variability and interannual variations in wood cellulose of two contrasting provenances of Pinus pinaster. Can. J. For. Res. 28: 766–773. [CrossRef] [Google Scholar]
- Nguyen-Queyrens A., Costa P., Loustau D., and Plomion C., 2002. Osmotic adjustment in Pinus pinaster cuttings in response to a soil drying cycle. Ann. For. Sci. 59: 795–799. [CrossRef] [EDP Sciences] [Google Scholar]
- Pennington R.E., Tischler C.R., Johnson H.B., and Polley H.W., 1999. Genetic variation for carbon isotope composition in honey mesquite (Prosopis glandulosa). Tree Physiol. 19: 583–589. [PubMed] [Google Scholar]
- Picon C., Guehl J.M., and Ferhi A., 1996. Leaf gas exchange and carbon isotope composition responses to drought in a drought-avoiding (Pinus pinaster) and a drought-tolerant (Quercus petraea) species under present and elevated atmospheric CO2 concentrations. Plant Cell Environ. 19: 182–190. [Google Scholar]
- Porte A. and Loustau D., 2001. Seasonal and interannual variations in carbon isotope discrimination in a maritime pine (Pinus pinaster) stand assessed from the isotopic composition of cellulose in annual rings. Tree Physiol. 21: 861–868. [PubMed] [Google Scholar]
- Ribeiro M.M., Plomion C., Petit R., and Vendramin, G.G., 2001.Variation in chloroplast single–sequence repeats in Portuguese maritime pine (Pinus pinaster Ait.). Theor. Appl. Genet. 102: 97–103. [CrossRef] [Google Scholar]
- Rowell D.M., Ades P.K., Tausz M., Arndt S.K., and Adams M.A., 2009. Lack of genetic variation in tree ring δ13C suggests a uniform, stomatally-driven response to drought stress across Pinus radiata genotypes. Tree Physiol. 29: 191–198. [CrossRef] [PubMed] [Google Scholar]
- SAS, 1999. SAS OnlineDoc version eight. SAS, Institute Inc., Cary, NC, USA. [Google Scholar]
- Sun Z.J., Livingston N.J., Guy R.D., and Ethier G.J., 1996. Stable carbon isotopes as indicators of increased water use efficiency and productivity in white spruce (Picea glauca (Moench) Voss) seedlings. Plant Cell Environ. 19: 887–894. [Google Scholar]
- Tognetti R., Michelozzi M., and Giovannelli A., 1997. Geographical variation in water relations, hydraulic architecture and terpene composition of Aleppo pine seedlings from Italian provenances. Tree Physiol. 17: 241–250. [PubMed] [Google Scholar]
- Tognetti R., Michelozzi M., Lauteri M., Brugnoli E., and Giannini R., 2000. Geographic variation in growth, carbon isotope discrimination, and monoterpene composition in Pinus pinaster Ait. provenances. Can. J. For. Res. 30: 1682–1690. [CrossRef] [Google Scholar]
- Voltas J., Chambel M.R., Prada M.A., and Ferrio J.P., 2008. Climate-related variability in carbon and oxygen stable isotopes among populations of Aleppo pine grown in common-garden tests. Trees 22: 759–769. [CrossRef] [Google Scholar]
- Warren C.R., McGrath J.F., and Adams M.A., 2001. Water availability and carbon isotope discrimination in conifers. Oecologia 127: 476–486. [CrossRef] [PubMed] [Google Scholar]
- Zas R., Merlo E., and Fernandez-Lopez J., 2004. Juvenile - Mature genetic correlations in Pinus pinaster ait. under different nutrient × water regimes. Silvae Genet. 53: 124–129. [Google Scholar]
- Zas R. and Fernandez-Lopez, J., 2005. Juvenile genetic parameters and genotypic stability of Pinus pinaster Ait. open-pollinated families under different water and nutrient regimes. For. Sci. 51: 165–174. [Google Scholar]
- Zhang J.W. and Mashall J.D., 1995. Variation in carbon-isotope discrimination and photosynthetic gas-exchange among populations of Pseudotsuga menziesii and Pinus ponderosa in different environments. Funct. Ecol. 9: 402–412. [CrossRef] [Google Scholar]
- Zhang J.W. and Cregg B.M., 1996. Variation in stable carbon isotope discrimination among and within exotic conifer species grown in eastern Nebraska, USA. For. Ecol. Manage. 83: 181–187. [CrossRef] [Google Scholar]
All Tables
Location and climatic data of the progeny trials and seed sources. P: Mean annual precipitation; T: Mean annual temperature; TM: Mean of maximum/mean temperature, in month with highest mean; Tm: Mean of minimum/mean temperature, in month with lowest mean. Xe: xeric, Me: mesic.
Summary of ANOVA significances. δ13C: isotope carbon composition; h: height. Num DF: numerator of degrees of freedom. Den DF: denominator of degrees of freedom. P: probability. F: F-values. Pop: population. Fam: family. Significant values in bold.
Summary of ANOVA significances by site and year (Xe/Me; 1st/2nd year). Abbreviations like in Table IIA.
All Figures
|
Figure 1 Climate in the study area according to the ombrothermogram of the nearby Allariz (A) and Aranda de Moncayo (B) meteorological stations. Precipitation information: dotted area, precipitation < 2 temperature (dry period); striped area, precipitation > 2 temperature (humid season). Temperature information at bottom: lower black block, period with probable frost (absolute monthly minimum temperature ≤ 0 °C and mean minimum temperature of the coldest month ≥ 0 °C); lower white block, frost-free months, i.e. mean minimum temperature of the coldest month ≥ 0 °C. |
| In the text | |
|
Figure 2 Representation of the carbon isotope composition (δ13C) vs. height (h). Population LS means the 1st (A) and 2nd years (B). Populations: Arenas (A), Oria (O) and Mimizan (M). Families per population in the xeric trial site, Xe: A (10), O (8) and M (6), and 10 families in the mesic trial site, Me (bold letters). Data are means ± standard errors. Higher values (less negative) are associated to higher water use efficiency. |
| In the text | |
|
Figure 3 Representation of the δ13C population means and standard errors across environments (Me: mesic trial site, Xe: xeric trial site, 1st y: first year, 2nd y: second year). M: white bars, A: grey bars, O: black bars. Division of X axis obtained from a PCA integrating precipitation and temperature values. Climate close to the origin of the X axis is drier, with more extreme maximum and minimum temperatures and becomes milder and wetter along the axis. Precipitation and mean of maximum and minimum temperature values of the hottest and coldest month, respectively: Xe, 1st year: 323 mm, 32.03 °C, –1.11 °C; Xe, 2nd year: 488 mm, 30.9 °C, 0.41 °C; Me, 1st year: 704 mm, 28.5 °C, 1.04 °C; Me, 2nd year: 969 mm, 26.7 °C, 2.1 °C. |
| In the text | |
|
Figure 4 Bi-directional population LS means ± standard errors for carbon isotope composition (δ13C, A1) and height (h, B1) in the 2 trial sites (axis X: Xe, axis Y: Me). Symbols: Arenas (A), Oria (O) and Mimizan (M) the 1st year. Bold letters the 2nd year. Bi-directional LS means ± standard errors for δ13C (A2) and h (B2) in a subsample of families present in both progeny trial sites. Symbols: ●, 1st year; ◯ , 2nd year. Diagonal lines represent equal values in both sites. |
| In the text | |