Free Access
Figure 1
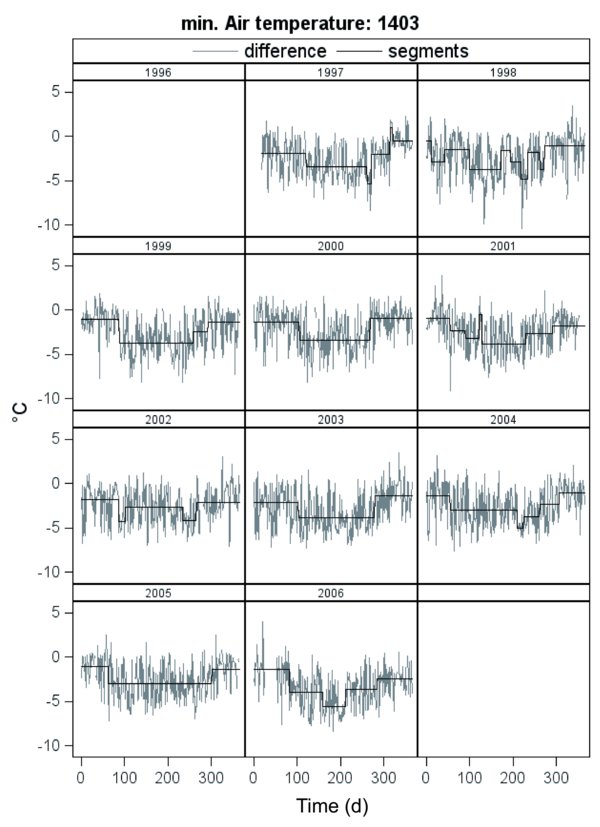
Daily differences of measured and interpolated minimum air temperature at site 1403 in Saxony/Germany (grey line) and averages of homogenous parts of the time series (black line).
Daily differences of measured and interpolated minimum air temperature at site 1403 in Saxony/Germany (grey line) and averages of homogenous parts of the time series (black line).