Free Access
Figure 1
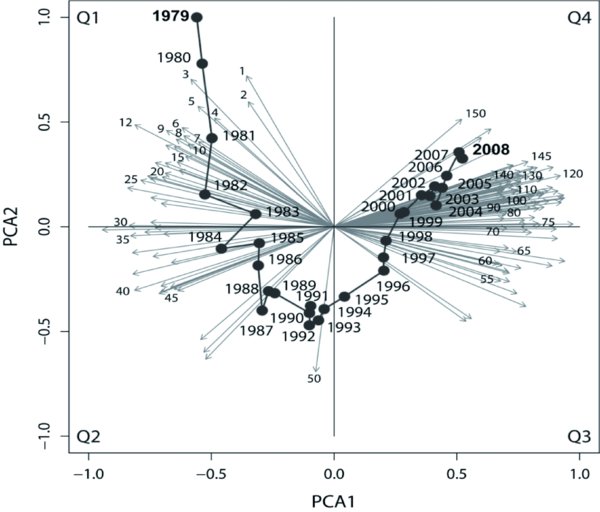
PCA biplot using log-transformed, relative counts of title words per year. The first and the second PCA axes accumulate 25.6% and 6.5% of total variance, respectively. Numbers refer to 150 best fitting title words as listed in Table I.