| Issue |
Ann. For. Sci.
Volume 66, Number 4, June 2009
|
|
|---|---|---|
| Article Number | 408 | |
| Number of page(s) | 10 | |
| DOI | https://doi.org/10.1051/forest/2009010 | |
| Published online | 06 May 2009 | |
Original article
Diversity of water use efficiency among Quercus robur genotypes: contribution of related leaf traitsDiversité de l’efficience d’utilisation de l’eau entre différents génotypes de Quercus robur : contributions des traits foliaires
Magali Roussel, Didier Le Thiec, Pierre Montpied, Nathalie Ningre, Jean-Marc Guehl and Oliver Brendel*
INRA, UMR1137 INRA - Nancy-Université “Écologie et Écophysiologie Forestières”,
IFR 110 54280 Champenoux, France
* Corresponding author: This email address is being protected from spambots. You need JavaScript enabled to view it.
Received: 29 April 2008
Accepted: 4 December 2008
• Previously, a large intra-specific diversity and a tight genetic control have been shown for Δ13C (carbon isotope discrimination) in a pedunculate oak (Quercus robur L.) family, which is an estimator for intrinsic water use efficiency (Wi), a complex trait defined as the ratio of net CO2 assimilation rate (A) to stomatal conductance for water vapour (gs).
• In the present study, twelve genotypes with extreme phenotypic values of Δ13C were selected within this family to (i) asses the stability of genotype differences across contrasting environments and for different measures Wi; (ii) quantify the relationship between Δ13C and Wi within this family; (iii) identify which leaf traits drive the diversity in Wi observed in this family.
• Genetic variability of Δ13C and Wi was largely independent from different temporal integration scales and their correlation was found to be strong (R2 = 88% for leaf sugars) within this family.
• Weak correlations between measures of Wi with estimators of photosynthetic capacity, suggest a minor role of the latter in the diversity of Wi.
• However, the tight correlation between gs and Δ13C as well as Wi, and the related genotypic variation in stomatal density, suggest that the genotypic diversity in Wi within this pedunculate oak family might be due to differences in gs.
Résumé
• Une large diversité intra-spécifique et un fort contrôle génétique ont été mis en évidence pour Δ13C (discrimination isotopique du carbone) dans une famille de chêne pédonculé (Quercus robur L.). Δ13C est un estimateur de l’efficience intrinsèque d’utilisation de l’eau (Wi), un caractère complexe défini comme le rapport entre l’assimilation nette de CO2 (A) et la conductance stomatique pour la vapeur d’eau (gs).
• Douze génotypes présentant des valeurs phénotypiques extrêmes de Δ13C ont été sélectionnés dans cette famille pour (i) évaluer la stabilité des différences génotypiques dans des environnements contrastés et pour différents estimateurs de l’efficience d’utilisation de l’eau ; (ii) quantifier la relation entre Δ13C et Wi dans cette famille; (iii) identifier quels caractères foliaires sont impliqués dans la diversité de Wi observée dans cette famille.
• La variabilité génétique de Δ13C et Wi était largement indépendante des différentes échelles d’intégration temporelles et leur corrélation était forte dans cette famille (R2 = 88% lorsque Δ13C était mesuré dans les sucres foliaires).
• Les faibles corrélations entre Wi (ou Δ13C) et des estimateurs de la capacité photosynthétique suggèrent un rôle mineur de celle-ci dans la diversité de Wi.
• Par contre, la corrélation étroite entre gs et Δ13C ainsi que Wi et la variation génétique de la densité stomatique, suggèrent que la diversité génétique de Wi dans cette famille de chêne pédonculé est liée à des différences de conductance stomatique gs.
Key words: carbon isotope discrimination / intrinsic water use efficiency / pedunculate oak / stomatal conductance / stomatal density
Mots clés : discrimination isotopique du carbone / efficience intrinsèque de l’ullisation de l’eau / clêne pedonculé / conductance stomatique / densité stomatique
© INRA, EDP Sciences, 2009
Abbreviations: Δ13C: 13C isotope discrimination (‰); Δ13Csu: Δ13C of extracted leaf sugars; Δ13Cst: Δ13C of extracted leaf starch; Δ13Cb: Δ13C of bulk leaf material; δ13C: carbon isotope composition (‰); δ13Cair: δ13C of atmospheric CO2 in the greenhouse; ci: CO2 mole fraction in intercellular air spaces (μmol mol−1) ; ca: atmospheric CO2 mole fraction (μmol mol−1) ; Wi: intrinsic water use efficiency (μmol mol−1) ; A: net CO2 assimilation rate (μmol m−2 s−1) ; Asat: light saturated A at ambient CO2 concentration; gs: stomatal conductance for water vapour (mol m−2 s−1); Vcmax: apparent maximum carboxylation rate of Rubisco (μmol m−2 s−1) ; Nmass: nitrogen content on a mass basis (mg g−1); Narea: nitrogen content on an area basis (g m−2); Chl: chlorophyll content (g m−2); SD: stomatal density (mm−2); SL: stomatal length (μm); SA: stomatal area (μm2); SAI: stomatal area index (mm−1); LMA: leaf mass-to-area ratio (g m−2); TLT: total leaf thickness (μm); UET: upper epidermis thickness (μm); LET: lower epidermis thickness (μm); PMT: palisade mesophyll thickness (μm); SMT: spongy mesophyll thickness (μm).
1. INTRODUCTION
A large intra-specific variability of 13C isotope discrimination (Δ13C) has been observed within natural stands of pedunculate oak (Quercus robur L.; Ponton et al., 2001), a widespread broad-leaved forest tree species from Western Europe. Leaf Δ13C is a widely used estimator of intrinsic water use efficiency, Wi, defined as the ratio of net CO2 assimilation rate (A) to stomatal conductance for water vapour (gs). The predicted relationship between Δ13C and Wi is negative (Farquhar and Richards, 1984) which has been observed for pedunculate and sessile oaks under different levels of shading (Ponton et al., 2002). Wi is a complex trait related to many physiological and structural leaf traits that directly or indirectly influence A or gs. Genetic variation in Wi or Δ13C has been shown within many tree species and was ascribed to variations in A (Johnsen and Major, 1995; Major and Johnsen, 1996; Xu et al., 2000), in gs (Cregg et al., 2000) or in both (Farquhar et al., 1989).
Brendel et al. (2008) investigated the genetic determinism of water use efficiency in a pedunculate oak full-sib family comprising 278 siblings. They found in this progeny a 40% variation of Wi as estimated by leaf Δ13C. The genetic control of Δ13C was oligogenic, with only a few Quantitative Trait Loci (QTL) explaining a large fraction of the observed variability of Δ13C (30% to 50%). The detected QTL pointed to two major regions on the genetic map of this full-sib family. The first region explained 21–31% of the observed variability, and was detected with independent measurements conducted for three successive years, suggesting that only low QTL × environment interactions occurred. The second region suggested an influence of photosynthetic capacity on the observed diversity in Δ13C and explained 9% of the observed variability.
Variation in A, when independent from gs, is due to variation in photosynthetic capacity. Theoretical considerations show that compounds involved in photosynthesis may account for well over three-quarter of total leaf nitrogen (Field and Mooney, 1986). Thus for different species photosynthetic capacity was found to correlate with total leaf nitrogen (Evans, 1989), including several oak species (Takashima et al., 2004). Leaf anatomy traits such as leaf density and thickness may also influence photosynthetic capacity (Niinemets, 1999) and modulate the photosynthesis-nitrogen relationships (Reich et al., 1998).
Physiological processes leading to stomatal aperture or closure are well known and recent progress has been made on genes involved in ABA and Ca+ signalling (Webb and Baker, 2002) and stomatal development (Bergmann, 2006). However, the main causes driving diversity in gs in natural populations are not yet well understood, both within and among species. Franks and Farquhar (2007) found an influence of the stomatal morphology of different species on maximum stomatal apertures and rapidity of movements. It has also been shown for temperate deciduous trees that the size of guard cells has an influence stomatal aperture and therefore contributes to the diversity of gs (Aasamaa et al., 2001). Further it has been suggested that maximum stomatal conductance is influenced by stomatal density (Nobel, 1999). Little is however known on the causes of within species diversity of stomatal conductance.
To study genetic, intraspecific diversity, and to assess genetic determinism and control of traits, a large number of siblings and vegetative copies (several hundred individuals) are required. This puts a severe practical constraint on the number of leaf traits that can be measured. Therefore we focused on a smaller number of individuals while maximising the differences in Wi and Δ13C. To this end, a few individuals (called genotypes hereafter) were selected for their extreme phenotypic values as observed by Brendel et al. (2008), to cover the diversity detected within the pedunculate oak full-sib family. Two strategies were used to sample genotypes: first, using Δ13C data measured during three successive years and second, using a combination of Δ13C with leaf nitrogen and chlorophyll content data. With the first sampling strategy genotypes were selected that have accumulated alleles with positive (or negative) effects on Δ13C, independently from the physiological process affecting discrimination. The second strategy aimed at maximizing the diversity of Δ13C caused by photosynthetic capacity, by selecting genotypes with simultaneously extreme phenotypic values for Δ13C, leaf nitrogen and chlorophyll content.
Although bulk leaf matter is often used for rapid estimates of Δ13C (e.g. for QTL studies as in Brendel et al., 2008), it is an aggregate of different carbon containing compounds, each with different integration patterns of Wi. This can cause discrepancies between Wi estimated from leaf bulk Δ13C and Wi estimated directly and instantaneously from gas exchange measurements. Soluble sugars and starch provide a Δ13C signal with a short time-integration due to their high turn-over rate (few days) (Brugnoli et al., 1988). Δ13C was therefore assessed from three different pools of organic matter (bulk leaf matter, starch, soluble sugars) to downscale from field measurements (Brendel et al., 2008) to instantaneous gas exchange. Further, genetic variation of certain leaf traits could disturb the relationship between Δ13C and intrinsic water use efficiency (Wi) by affecting the parameters of the theoretical model.
Therefore our main objectives were to:
(i) asses the stability of genotype differences acrosscontrasting environments and for different measures ofintrinsic water use efficiency (Wi);
(ii) quantify how genetic variation in Δ13C relates to genetic variation in Wi within this family;
(iii) identify which leaf traits drive the diversity in Wi observed in this family.
2. MATERIALS AND METHODS
2.1. Plant material and growth conditions
Genotypes used in this study were selected within a pedunculate oak progeny (F1 of 278 clones) which has been used several times for QTL detection (Brendel et al., 2008; Parelle et al., 2007; Scotti-Saintagne et al., 2004; 2005). Selection criteria were based on phenotypic data recorded under natural conditions at Bourran (South Western France) (Brendel et al., 2008). The traits used were carbon isotope discrimination of bulk leaf organic matter (Δ13Cb), chlorophyll (Chl) and nitrogen content (Narea, Nmass) of leaves. Genotypes with extreme phenotypes for Δ13C (i.e. “low Δ” or “high Δ”) were selected on the basis of extreme values of leaf Δ13C recorded during three years of measurements (2000 to 2002). Genotypes were chosen which showed extreme low or extreme high leaf δ13C data for all three years. In parallel, genotypes with extreme phenotypes concurrently for Δ13C, chlorophyll concentration and leaf N (i.e. “low N” or “high N”) were selected on the basis of displaying simultaneously high values of leaf Δ13C and low values of chlorophyll concentration and leaf nitrogen content recorded in 2001 and inversely. This selection was founded on the hypothesis that genotypes with low photosynthetic capacity, estimated by low values of leaf nitrogen and chlorophyll would show low Wi, and thus high leaf δ13C. Three genotypes were chosen for each of the extreme phenotypes: “low Δ” (siblings 159, 171, 287), “high Δ” (136, 170, 263), “low N” (151, 237, 351) and “high N” (259, 261, 267), forming a set of twelve genotypes overall.
Clonal copies of the selected genotypes were produced in summer 2003 by UMR BioGECo, INRA Pierroton (South Western France) and then transferred to a greenhouse at Champenoux near Nancy (North Eastern France) during December 2003. The experiment took place during summer 2004. The trees were transplanted to 10 L containers with a peat and sand mixture (1/1, v/v). A complete fertilisation (4.5 g L−1 of slow-release fertiliser Nutricote T100: N, P, K, Mg, 13,13,13,2 + trace elements and 0.2 g L−1 of lime) was provided. All individuals were watered to field capacity three times daily with deionised water. Air temperature control of the greenhouse was set to a minimum of 15 °C and a maximum of 25 °C, otherwise within this range greenhouse temperature was following outside temperature variations. Relative humidity (68± 12%, average ± standard deviation), CO2 concentration (394 ± 12 μmol mol−1) and daily global irradiance were continuously recorded in the greenhouse. The plants were grown under natural photoperiod. As pedunculate oaks show a periodical growth during the growing season (“flushes”), all measurements were done on unshaded adult second flush leaves.
Four vegetative copies (rooted cuttings) of each genotype were used as replicates. The complete experiment consisted of 40 plants overall that were placed in a greenhouse with a randomized complete block design. One vegetative copy of each gentoype was placed in each block, with four blocks overall. Due to some mortality of rooted cuttings, especially in the phenotype “high Δ”, the number of clonal copies of three genotypes was only one or two.
2.2. Extraction of soluble sugars and starch from leaves, and carbon isotope analysis
At the beginning of July, one leaf was harvested on each individual plant, oven-dried (60 °C) and ball-milled for carbon isotope analysis of bulk leaf matter. Additionally, three to five leaves were harvested separately for extraction of soluble sugars and starch, freeze-dried for 24 h and then ball-milled. The method of extraction was adapted from Dickson and Larson (1975). Extraction was carried out using 200 mg of leaf powder with 2 mL of a mixture of methanol/chloroform/water (12:5:3, v/v/v). After shaking with a vortex mixer, and 30 min at ambient temperature, tubes were centrifuged for 10 min at 2000 g and 4 °C. The supernatant was recovered, a second extraction was run on the pellet and the second supernatant was added to the first. Then 1 mL of methanol 60% was added to the pellet, and this solution was stored at –20 °C for starch extraction. Sugar extraction continued using the supernatant by addition of 2 mL of a mixture methanol/chloroform (1:1 v/v) and 1.2 mL of distilled water. After vortexing, and centrifugation (5 min, 2000 g, 4 °C), the upper phase was collected and 0.5 mL of methanol (60%) was added to the remainder. After vortexing again, and centrifugation, the supernatant was retained and added to the first one. Methanol and water were then evaporated overnight in a vacuum concentration system (1 mbar, 30 °C, Heto, Denmark).The pellet was rehydrated with 0.5 mL distilled water and vortexed. Soluble sugars were then separated from the aqueous extract through a multilayer extraction column, consisting of (i) PVPP (Polyvinylpolypyrrolidone, Sigma-Aldrich, Germany) to retain phenols and tannins; (ii) Dowex − 50 (H+) resin (Sigma-Aldrich, Germany) used for separation of amino acids from organic acids and sugars and (iii) Amberlite IRA-402 (Cl−) resin (Sigma-Aldrich, Germany) used for separation of organic acids from sugars. The soluble sugars were eluted with 8 mL of distilled water. The eluate was reduced in a vacuum concentration system. The pellet was stored at − 20 °C before carbon isotope analysis.
The pellet kept for starch extraction in methanol was centrifuged (10 min, 2000 g, 4 °C), the supernatant was discarded and the residue was dried for 15 min in a vacuum concentration system. The pellet was then suspended in 1 mL of HCl 6N. After vortexing and centrifugation (5 min, 2000 g, 4 °C), the supernatant was retained and mixed with 8 mL of 60% methanol. Starch was then precipitated one day at − 20 °C and dried with the vacuum concentration system. Samples of starch were stored at − 20 °C before carbon isotope analysis. Extracted sugars and starch represented about 9% and 5% of the bulk leaf dry mass, respectively.
The carbon isotope composition of 1 mg of bulk leaf, soluble sugar or starch organic material was measured with a continuous flow isotope ratio mass spectrometer (Delta S; Thermo Finnigan, Bremen, Germany) coupled to an elemental analyser (Carlo Erba NA 1500 NC, Rodano, Italy). The relative abundance of 13C (‰) was expressed as (Craig, 1957):

where Rs and Rb refer to the 13C/ 12C ratio in the sample and in the Pee Dee Belemnite standard, respectively.
Carbon isotope discrimination (Δ13C) was calculated as:

The modelled relationship between Δ13C and Wi is (Farquhar and Richards, 1984) :
2.3. Gas exchange measurements
Leaf gas exchange was recorded on one leaf per individual plant during July 2004, with an open flow gas exchange system (Li-6400, Li-Cor, Lincoln, NE, USA). Leaves were inserted into the chamber and photosynthesis was induced for about 40 min at 25 °C, at a CO2 mole fraction of 390 μmol mol−1, a photosynthetic photon flux density of 1200 μmol m−2 s−1, and an air flux of 300 μmol s−1. Light saturated net CO2 assimilation rate (Asat) and stomatal conductance for water vapour (gs) were recorded and intrinsic water use efficiency (Wi) was computed as the ratio between Asat and gs. Response curves of net assimilation rate (A) to CO2 mole fraction in intercellular air spaces (ci) were recorded with the following procedure: a decrease in CO2 mole fraction from 390 μmol mol−1 to 50 μmol mol−1 in five steps. For each step, four min were allowed for gas exchange stabilization before measuring three times environmental parameters, Aand estimating ci. These curves were used to adjust maximal carboxylation rate of Rubisco (Vcmax; von Caemmerer and Farquhar, 1981) as described by Dreyer et al. (2001). The adjusted model did not explicitly include internal conductance to CO2, and the computed values represent therefore apparent Vcmax.
2.4. Chlorophyll content
Relative chlorophyll content (in CCI unit) was estimated using a CCM-200 (Chlorophyll Content Meter, Opti-Sciences, Hudson, NH, USA). Total chlorophyll content per leaf area (Chl) was derived using the following relationship calibrated for oak using biochemical chlorophyll extraction according to Barnes et al. (1992):
Total chlorophyll content was measured two times at different dates on three leaves per tree with three to five replicates per leaf. The data presented in this study are the least-square mean for each gentoype calculated from an Analysis of Variance model taking into account the date effect.
2.5. Leaf nitrogen content and leaf mass-to-area ratio
Leaf mass-to-area ratio (LMA) and leaf nitrogen content (Narea, Nmass) were estimated for the leaves used for δ13C analysis of bulk leaf organic matter. Area of fresh leaves was measured with a Leaf Area Meter (Delta-T Devices Ltd., Cambridge, UK), whereas mass was determined after drying and LMA was calculated as the ratio of leaf mass per area. Nmass was measured during isotopic analysis with the elemental analyser (Carlo Erba NA 1500 NC, Rodano, Italy) that was coupled to the mass spectrometer. Leaf nitrogen content on an area basis (Narea) was calculated from Nmass times LMA.
2.6. Leaf anatomy
An additional three leaves were harvested for leaf anatomy. Overall 14 discs (1 cm2) were punched from three leaves per vegetative copy of each genotype for measuring stomatal density and leaf anatomy and were immediately frozen in liquid nitrogen and stored at –80 °C. Microphotographs were made with a variable pressure scanning electron microscope (model 1450VP, Leo, Cambridge, UK, 20–30 Pa inside chamber, accelerating voltage 15 kV, working distance 12 mm) and analysed for stomatal density and stomatal dimensions using the Visilog software (Noesis, France).
One microphotograph of the abaxial epidermis (0.72 mm2) of nine discs from three different leaves was used to estimate stomatal density (SD). On each of the microphotographs 50 stomata were sampled for measuring guard cell surface (SA) and length (SL). Stomatal area index (SAI; Bruschi et al., 2003) was calculated as stomatal density× stomatal length, which can be seen as a rough indicator of potential total stomatal opening per leaf surface.
On the five other discs (1 cm2), four semi-thin cryo sections were photographed to measure total leaf thickness (TLT) and thickness of palisade (PMT), or spongy mesophyll (SMT), or upper and lower epidermal layers (UET and LET, respectively).
2.7. Statistical analyses
Using the whole data-set, correlations between traits were computed using STATISTICA software Version 7.1 (StatSoft, Inc. 2005). Correlations are based on genotype means and can therefore be seen as representing genetic differences among siblings within the family. Pearson’s correlation coefficients were estimated with a correlation matrix or with regression analyses. As all correlations were based on the combination of two continuous variables, model II regression (geometric mean regression) was used to estimate the equation parameters (Sokal and Rohlf, 2000). All statistical tests were considered significant when p < 0.05.
Correlation coefficients (R) between genotype means of leaf traits (N = 12).
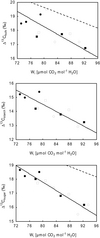 |
Figure 1 Relationship between genotype means of 13C isotope discrimination (soluble sugars (Δ13Csugars), starch (Δ13Cstarch) and bulk matter (Δ13Cbulk) and Wi for the phenotypes “Δ”and “N”. Open circles represent genotypes with the phenotype “low Δ”, open squares “low N”, closed circles “high Δ”, closed squares “high N”. The dash line represents the theoretical relationships (Sect. 2.2.) |
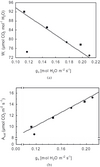 |
Figure 2 Relationship between stomatal conductance and (a) intrinsic water use efficiency (Wi) or (b) light saturated assimilation rate (Asat). Each point represents the mean of a genotype. Symbols as in Figure 1. For the outlier in graph a, only one copy had been available for this genotype (170). |
Analyses of variance were done with the R 2.5.0 software (R Development Core Team, 2007) and effects were considered significant at p < 0.05. Comparisons with earlier results (Brendel et al., 2008) on δ13Cbulkwere analysed using the following model :

where ylmn is the variable of interest, μthe overall mean, githe genotype effect, ejthe environment effect, (ge) ijthe genotype × environment interaction and εikrthe residuals. Partial coefficients of determination (R2) for the effects of this ANOVA were calculated as the sums of squares (SS) of the effect divided by total SS. This is a measure of the proportion of the total variation that is explained by one effect.
The difference of “low versus high” within “ Δ” or “N” extremes (thereafter called phenotype effect) was analysed on each variable of interest with a linear mixed model (nlme R-package, Pinheiro et al., 2007) of the form:

where ylmr is the variable of interest, μthe overall mean, αl the phenotype fixed effect, bm the random block effect, gi the fixed genotype effect and εlir the residuals.
Block effects were checked with a log likelihood ratio test between models with and without a random block effect. They were for all traits non-significant (p > 0.05) and excluded from the model.
Residuals were assumed to follow a joint normal distribution with zero means, zero covariances and variances either constant (homoscedastic model) or different among copies of each genotype (heteroscedastic model). Heteroscedasticity was checked with a log likelihood ratio test between homoscedastic and heteroscedastic models and the appropriate model was retained for each analysis.
3. RESULTS
3.1. Comparison with earlier results
An ANOVA using individual data (years 2000 and 2002) from Brendel et al. (2008) and Δ13C bfrom the present study showed significant effects (p < 0.05) for genotype (partial R2 = 39%), environment (37%) and genotype × environment interaction (6.0%), explaining overall 82% of the observed variance.
3.2. Correlations among different measures of Wi
Δ13C of the different metabolic compartments (bulk leaf, soluble sugars and starch) were all significantly correlated to Wi calculated from gas exchange measurements (Tab. I, Fig. 1). There was an improvement of the correlation from bulk leaf matter (R2 = 52.9%), over starch (R2 = 76.4%), to sugars (R2 = 87.6%). Slopes were similar between Δ13Csu / Wi and Δ13Cst / Wi, whereas the intercept differed due to the isotopic shift from sugars to starch (3.2± 0.4‰). The slope with bulk leaf matter differed from the two above, but the isotopic signal of sugars was closer to the overall bulk leaf matter (difference 0.5± 0.7‰).
The relationship of Wi with Δ13Csu was similar to that predicted by the model (Farquhar and Richards, 1984), but had a significantly steeper slope (p < 0.01; ANCOVA), whereas the slopes forΔ13Cst and Δ13Cb did not differ from the model (dash line in Fig. 1). Regressions of Wi with carbon isotope composition data of bulk leaf material recorded in the field by Brendel et al. (2008) were highly significant (p < 0.005), and R 2was 0.77 (N = 12, data recorded during 2000), 0.74 (N = 9, data recorded during 2001) and 0.67 (N = 12, data recorded during 2002).
Genotype effect estimated for all data (p-level; explained variance) and means, standard deviations (SD) and differences (p-level) between extreme phenotypes “Δ” and “N” (see text for the definition of the phenotypes).
Genotypes with higher Wi had significantly lower stomatal conductance (Fig. 2a), and had also a tendency to lower Asat (Tab. I). Genotypes with higher Asat showed higher values of Vcmax (Tab. I) and higher stomatal conductance (Fig. 2b). Traits related to photosynthesis such as chlorophyll content, leaf nitrogen content or Vcmax were not intercorrelated (Tab. I). However genotypes with higher stomatal conductance did also have an increased stomatal density (Tab. I) and a higher Δ13Cb (Fig. 3). Differences among genotypes in stomatal anatomy were concurrent with differences in density such that genotypes with longer stomata (SL) had a lower stomatal density. Differences among genotypes in thickness of leaf parenchyma did not concur with differences in Δ13Cb , Wi or gas exchange parameters.
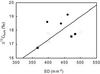 |
Figure 3 Relationship between Δ13C of bulk leaf matter (Δ13Cb) and stomatal density (SD). Symbols as in Figure 1. Equation of the geometric mean correlation: Δ13Cb = 10.6 + 0.02 SD, r = 0.68, p = 0.02. Each point represents the mean of a genotype. |
3.3. Differences in Δ13C and associated leaf traits between extreme phenotypes
Genotypes for this study had been chosen because they displayed extreme phenotypes. Therefore, we compared genotypes with high versus low phenotype values using an ANOVA. This is a more stringent test compared to the correlation analysis and results are presented in Table II.
Values of 13C isotope discrimination of bulk, starch and soluble sugars (Δ13Cb , Δ13Cst andΔ13Csu , respectively) differed significantly between the phenotypes “low Δ” and “high Δ”. Differences between the phenotypes “low N” and “high N” were significant for Δ13Cb and Δ13Cst only. The mean differences in Δ13C correspond to a 6 to 13% difference in Wi between the extremes “N” and 26 to 30% between the extremes “ Δ”. Differences between “low N” and “high N” or “low Δ” and “high Δ” were not significant for intrinsic water use efficiency (Wi), light saturated net CO2 assimilation rate at ambient CO2 concentration (Asat), stomatal conductance for water vapour (gs), and apparent maximal carboxylation rate of Rubisco (Vcmax) (Tab. II).
The “high N” phenotypes displayed a consistently higher leaf N than “low N”, whereas there was no difference between “low Δ” and “high Δ” (Tab. II) for leaf nitrogen. Chlorophyll content (Chl) and leaf mass-to-area ratio (LMA) were similar among the phenotypes (Tab. II).
Among the measured leaf anatomy traits, only palisade mesophyll thickness (PMT) differed between “low N” and “high N”, the former being 2.9 μm thicker (Tab. II). Stomata were significantly longer in “high N” compared to “low N” (Tab. II) whereas stomatal density (SD) and stomatal area index (SAI) were significantly smaller for “low Δ” compared to “high Δ” (Tab. II).
4. DISCUSSION
4.1. Stability of genotypic differences for different measures of Wi
The tight correlations found between Δ13C recorded on different metabolic compartments with varying turnover rates (bulk material, starch and soluble sugars), and therefore temporal integration scales (Brugnoli et al., 1988; Brugnoli and Farquhar, 2000), suggest that differences among genotypes are robust with respect to these time-scales. The relationships found between temporally independent measurements of Wi and Δ13C are close to the relationship predicted by the theoretical model (Farquhar and Richards, 1984), where Δ13C of material with shorter temporal integration results in tighter correlation with Wi estimated from instantaneous gas exchange measurements (Fig. 1). It should be stressed that these relationships between Wi and Δ13C were due to genetic differences among genotypes under common, optimal conditions and not due to acclimation of water use efficiency to different environmental conditions as observed in earlier studies (Guehl et al., 1994; Picon et al., 1996; Ponton et al., 2002). An observed genetic variability of Δ13C can relate to a variability of Wi as well as to a variability of the parameters of the theoretical model linking these two traits. In fact, the correlation between Δ13C and Wi observed by Brendel et al. (2008) was weak (R2 = 0.07), suggesting that either a large part of the variability of Δ13C was not related to Wi or that Wi from gas exchange measurements were estimated with much noise due to environmental influence. The here presented data, using more representative gas exchange measurements, showed that up to 87% of the genetic variability observed in Δ13C can be related to Wi. Therefore, the closeness between observations and model affirms that measurement of carbon isotope discrimination on leaf bulk material in this pedonculate oak family (e.g. Brendel et al., 2008) reflected to a high degree variation in Wi.“
Low Δ” and “high Δ” phenotypes showed values forΔ13C consistent with the sampling strategy, i.e., “low Δ” displayed significantly lower values than “high Δ”. When data from the present study and from Brendel et al. (2008) were compared, the relative differences among genotypes for Δ13C were found to be largely independent from environmental conditions, that is there was very little genotype × environment interaction. The relatively large overall environmental effect is probably due to the climate differences, where the field site in southern France was drier and hotter compared to the well-irrigated plants in the temperature controlled greenhouse. Thus, genotypic differences in Δ13C were conserved among years, through contrasting environments and among different metabolic pools, which extends observations made by Johnsen et al. (1999) on Picea mariana and Lauteri et al. (1997) on Castanea sativa.
5. VARIABLES DRIVING VARIATION OF WI WITHIN THIS PEDUNCULATE OAK FAMILY
Wi is calculated as the ratio between assimilation rate and stomatal conductance and therefore systematic variation of both traits among genotypes can change Wi. Furthermore, variation in Amight be controlled by variation in gand vice versa. Here, variation detected among genotypes for light saturated gs and Asat suggest a strong control ofgs on Asat and thus a major influence of gs on differences inWi. Differences in Asat were representing differences in photosynthetic capacity as estimated by Vcmax, however, again, there was an overall correlation between Vcmax and gs. Variation in leaf nitrogen and chlorophyll content among genotypes did not have an effect on Vcmax, Asat or on Wi. Also thickness of leaf parenchyma, which could theoretically have an impact on photosynthetic capacity, did not show any relationship with estimators of Wi. Overall, variation in traits related to photosynthetic capacity did not seem to be the driver for variation in any of the estimators of intrinsic water use efficiency.
Variation in Wi due to photosynthetic capacity had been studied specifically by using the selected “low N” and “high N” genotypes. This selection was effective for Δ13C and leaf nitrogen content, as the expected differences were observed between the extreme phenotypes, whereas it was not effective for leaf chlorophyll content. This might be due to a low heritability of leaf chlorophyll. To our knowledge, heritability of chlorophyll content has not yet been estimated in a temperate forest tree species. Narrow sense heritability estimates for leaf chlorophyll content for other plant types rarely exceed 50% (e.g. Collaku et al., 2005; Kabanova et al., 2000 for wheat, Hervé et al., 2001 for sunflower), suggesting considerable environmental influence. This might be due to rapid (within days) acclimation to current irradiance, as shown by Frak et al. (2001) for Juglans nigra x regia seedlings. Additionally to the specific selection of “N” genotypes, the pedunculate oak saplings in the present study were raised with optimal water supply, which should reduce the stomatal limitation of assimilation rate and thus facilitate the expression of differences in photosynthetic capacity. However, “low N” and “high N” did not present difference in Asat or in Vcmax, suggesting that the diversity of photosynthetic capacity might either not be well estimated by leaf N and chlorophyll content or not be a driver for variability in Wi within this family.
Otherwise, variation in stomatal conductance was a driver for the variation of Wi, as suggested by the strong correlation of gs with Wi and Δ13Csu. Brendel et al. (2008) had not detected an correlation between δ13C or Wi and gs, probably due to the difficulties of measuring gas exchange in the field. Further, the differences among genotypes in gs concur with differences in stomatal density (SD), i.e. genotypes with higher gs also dispayed more stomata per leaf surface. Differences in stomatal density were also related to differences in Δ13Cb , and a similar tendency was detected for other estimates of Wi. Few publications have analysed the relationship between Δ13C and stomatal density among genotypes. A positive relationship between Δ13C and stomatal density was also found for Pinus ponderosa provenances (Cregg et al., 2000) and among poplar clones from Populus deltoides × nigra hybrids (Monclus et al., 2006), whereas Dillen et al. (2008) found a negative relationship for a Populus deltoides × trichocarpa family. Genotypes with larger stomatal density showed higher gs, which could lead to lower Wi. The model proposed by Nobel (1999) suggests a positive relationship between stomatal density and gs. This was confirmed by Pearce et al. (2006) for several poplar species in a common garden and by Kundu and Tigerstedt (1999) for different provenances of Azadirachta indica in a greenhouse. A positive relationship between stomatal density and gs would thus be the link for the observed positive correlation between Δ13C and stomatal density, and could therefore be a cause for the observed diversity in Wi among genotypes of this pedunculate oak family. We also observed that genotypes with an increased stomatal density had smaller stomata (based on estimates of stomatal guard cell length SL). A similar relationship was observed by Hetherington and Woodward (2003) across different species but also within species. This relationship suggests a compensating effect resulting in a stable total stoma opening area. However our data suggest that this trade-off was only of limited extent as stomatal area index (SAI = SL × SD), an estimator of total stoma opening area, still showed differences among genotypes related to differences in Δ13Cb. Aasamaa et al. (2001) have shown for tree species that the size of guard cells has an influence on stomatal aperture and thus on gs. These results suggest a possible impact of stomatal density on variation in Δ13C and thus Wi via a genetic diversity in maximum stomatal conductance within this family of pedunculate oak. According to Bergmann and Sack (2007), few gene products are required to regulate patterns of stomata in leaves. It has been shown in Arabidopsis thaliana that the gene ERECTA, which influences water use efficiency, can affect modulates mesophyll cell proliferation as well as stomatal density (Masle et al., 2005).
6. CONCLUSION
Using a relatively small number of siblings from a large pedunculate oak progeny, we showed that the diversity detected for Δ13C in this progeny was closely related to instantaneous, intrinsic water use efficiency (Wi), as expected from the theoretical model linking these two traits (Farquhar and Richards, 1984). Genetic variability of Δ13C and Wi was largely independent from different temporal integration scales and from different environments. We were not able to substantiate the influence of photosynthetic capacity on Wi or Δ13C that had been suggested by the co-localisation of QTL for Δ13C, nitrogen and chlorophyll content. However, the large genetic variation in stomatal density and stomatal area index, as well as the tight correlation between stomatal conductance and Δ13C suggest that differences in water use efficiency within this pedunculate oak family might be due to differences in stomatal conductance.
Acknowledgments
We would like to thank Erwin Dreyer as well as two anonymous reviewers for their abundant suggestions on the manuscript. We are also grateful to Claude Bréchet for the δ13C measurements and help in sugar and starch extractions, Pascale Maillard for the procedure of sugar and starch extraction, Patrick Gross for greenhouse management, Jean-Marie Gioria and Christophe Bailly for their technical assistance in greenhouse. We also thank Evangelista Bertocchi of INRA Pierroton for producing the rooted cuttings and Antoine Kremer for providing access to the pedunculate oak off-spring family.
References
- Aasamaa K., Sõber A., and Rahi M., 2001. Leaf anatomical characteristics associated with shoot hydraulic conductance, stomatal conductance and stomatal sensitivity to changes of leaf water status in temperate deciduous trees. Aust. J. Plant Physiol. 28: 765–774.
- Barnes J.D., Balaguer L., Manrique E., Elvira S., and Davison A.W., 1992. A reappraisal of the use of DMSO for the extraction and determination of chlorophylls a and b in lichens and higher plants. Environ. Exp. Bot. 32: 85–100 [CrossRef].
- Bergmann D., 2006. Stomatal development: from neighborly to global communication. Curr. Opin. Plant Biol. 9: 478–483 [PubMed] [CrossRef].
- Bergmann D.C. and Sack F.D., 2007. Stomatal Development. Ann. Rev. Plant Biol. 58: 163–181 [CrossRef].
- Brendel O., Le Thiec D., Saintagne C., Kremer A., and Guehl J.M., 2008. Quantitative trait loci controlling water use efficiency and related traits in Quercus robur L. Tree Genet. Genomes 4: 263–278 [CrossRef].
- Brugnoli E., Hubick K.T., von Caemmerer S., Wong S.C., and Farquhar G.D., 1988. Correlation between the carbon isotope discrimination in leaf starch and sugars of C3 plants and the ratio of intercellular and atmospheric partial pressures of carbon dioxide. Plant Physiol. 88: 1418–1424 [PubMed] [CrossRef].
- Brugnoli E. and Farquhar G.D., 2000. Photosynthetic fractionation of carbon isotopes. In: Leegood R.C., Sharkey T.D., von Caemmerer S., (Eds.) Photosynthesis: Physiology and Metabolism, Kluwer Academic Publishers, pp. 399–434.
- Bruschi P., Grossoni P., and Bussoti F., 2003. Within- and among-tree variation in leaf morphology of Quercus petraea (Matt.) Liebl. natural populations. Trees 17: 164–172.
- Collaku A. and Harrison S.A., 2005. Heritability of waterlogging tolerance in wheat. Crop. Sci. 45: 722–727.
- Craig H., 1957. Isotopic standards for carbon and oxygen and correction factors for massspectrometric analysis of carbon dioxide. Geochim. Cosmochim. Acta 12: 133–149 [CrossRef].
- Cregg B.M., Olivas-Garcia J.M., and Hennessey T.C., 2000. Provenance variation in carbon isotope discrimination of mature ponderosa pine trees at two locations in the Great Plains. Can. J. For. Res. 30: 428–439 [CrossRef].
- Dickson R.E. and Larson P.R., 1975. Incorporation of 14C-photosynthate into major chemical fractions of source and sink leaves of cottonwood. Plant Physiol. 56: 185–193 [PubMed] [CrossRef].
- Dillen S., Marron N., Koch B., and Ceulemans R., 2008. Genetic variation of stomatal traits and carbon isotope discrimination in two hybrid poplar
families (Populus deltoides “s9-2”
 P. nigra “ghoy” and P. deltoides “s9-2” P. trichocarpa “v24”. Ann. Bot. 102: 399–407 [PubMed] [CrossRef].
- Dreyer E., Le Roux X., Montpied P., Daudet F.A., Masson F., 2001. Temperature response of leaf photosynthetic capacity in seedlings from seven temperate tree species. Tree Physiol. 21: 223–232 [PubMed].
- Evans J.R., 1989. Photosynthesis and nitrogen relationships in leaves of C3 plants. Oecologia 78: 9–19 [CrossRef].
- Farquhar G.D. and Richards R.A., 1984. Isotopic composition of plant carbon correlates with water use efficiency of wheat genotypes. Aust. J. Plant Physiol. 11: 539–552.
- Farquhar G.D., Ehleringer J.R., and Hubick K.T., 1989. Carbon isotope discrimination and photosynthesis. Ann. Rev. Plant Physiol. Plant Mol. Biol. 40: 503–537 [CrossRef].
- Field C. and Mooney H.A., 1986. The photosynthesis-nitrogen relationship in wild plants. In: Givnish T.J., (Ed.) On the Economy of Plant Form and Function, Cambridge University Press, Cambridge, pp. 25–55.
- Frak E., Le Roux X., Millard P., Dreyer E., Jaouen G., Saint-Joanis B., and Wendler R., 2001. Changes in total leaf nitrogen and partitioning of leaf nitrogen drive photosynthetic acclimation to light in fully developed walnut leaves. Plant Cell Environ. 24: 1279–1288 [CrossRef].
- Franks P. and Farquhar G., 2007. The mechanical diversity of stomata and its significance in gas-exchange control. Plant Physiol. 143: 78–87 [PubMed] [CrossRef].
- Guehl J.M., Picon C., Aussenac G., and Gross P., 1994. Interactive effects of elevated CO2 and soil drought on growth and transpiration efficiency and its determinants in two European forest tree species. Tree Physiol. 14: 707–724 [PubMed].
- Hervé D., Fabre F., Berrios E.F., Leroux N., Alchaarani G., Planchon C., Sarrafi A., and Gentzbittel L., 2001. QTL analysis of photosynthesis and water use status traits in sunflower (Helianthus annuus L.) under greenhouse conditions. J. Exp. Bot. 52: 1857–1864 [PubMed] [CrossRef].
- Hetherington A.M. and Woodward F.I., 2003. The role of stomata in sensing and driving environmental change. Nature. 424: 901–908 [PubMed] [CrossRef].
- Johnsen K.H. and Major J.E., 1995. Gas exchange of 20-year-old black spruce families displaying a genotype environment interaction in growth rate.
Can. J. For. Res. 25: 430–439 [CrossRef].
- Johnsen K.H., Flanagan L.B., Huber D.A., and Major J.E., 1999. Genetic variation in growth, carbon isotope discrimination, and foliar N concentration in Picea mariana: analyses from a half-diallel mating design using field-grown trees. Can. J. For. Res. 29: 1727–1735 [CrossRef].
- Kabanova, S.N., Kabashnikova, L.F., and Chaika, M.T., 2000. Specifity of genetic determination of content of photosynthetic pigments in Triticale. Biol. Plant. 43: 529–535 [CrossRef].
- Kundu S.K. and Tigerstedt P.M.A., 1999. Variation in net photosynthesis, stomatal characteristics, leaf area and whole-plant phytomass production among ten provenances of neem (Azadirachta indica). Tree Physiol. 19: 47–52 [PubMed].
- Lauteri M., Scartazza A., Guido M.C., and Brugnoli E., 1997. Genetic variation in photosynthetic capacity, carbon isotope discrimination and mesophyll conductance in provenances of Castanea sativa adapted to different environments. Funct. Ecol. 11: 675–683 [CrossRef].
- Major J.E. and Johnsen K.H., 1996. Family variation in photosynthesis of 22-year-old black spruce: A test of two models of physiological response to water stress. Can. J. For. Res. 26: 1922–1933 [CrossRef].
- Marino B.D. and McElroy M.B., 1991. Isotopic composition of atmospheric CO2 inferred from carbon in C4 plant cellulose. Nature 349: 127–131 [CrossRef].
- Masle J., Gilmore S.R., and Farquhar G.D., 2005. The ERECTA gene regulates plant transpiration efficiency in Arabidopsis. Nature 436: 866–870 [PubMed] [CrossRef].
- Monclus R., Dreyer E., Villar M., Delmotte F.M., Delay D., Petit J.M.,
Barbaroux C., Le Thiec D., Bréchet C., and Brignolas F., 2006. Impact of
drought on productivity and water use efficiency in 29 genotypes of Populus deltoides Populus nigra. New Phytol. 169: 765–777 [PubMed] [CrossRef].
- Niinemets Ü., 1999. Research review. Components of leaf dry mass per area – thickness and density – alter leaf photosynthetic capacity in reverse direction in woody plants. New Phytol. 144: 35–47.
- Nobel P.S., 1999. Resistances and conductances – Transpiration. In: Physicochemical and environmental plant physiology. 2nd ed. Academic Press, San Diego, 635: pp. 301–303.
- Parelle J., Zapater M., Scotti-Saintagne C., Kremer A., Jolivet Y., Dreyer E., and Brendel O., 2007. Quantitative Trait Loci of tolerance to water-logging in a European oak (Quercus robur L.): physiological relevance and temporal effect patterns. Plant Cell Environ. 30: 422–434 [PubMed] [CrossRef].
- Pearce D.W., Millard S., Bray D.F., and Rood S.B., 2006. Stomatal characteristics of riparian poplar species in a semi-arid environment. Tree Physiol. 26: 211–218 [PubMed] [CrossRef].
- Picon C., Guehl J.M., and Aussenac G., 1996. Growth dynamics, transpiration and water use efficiency in Quercus robur plants submitted to elevated CO2 and drought. Ann. Sci. For. 53: 431–446 [CrossRef].
- Pinheiro J., Bates D., DebRoy S., and Sarkar D., 2007. nlme: linear and nonlinear mixed effects models. R package version 3.1–81.
- Ponton S., Dupouey J.L., Breda N., and Dreyer E., 2001. Carbon isotope discrimination and wood anatomy variations in mixed stands of Quercus robur and Quercus petraea. Plant Cell Environ. 24: 861–868 [CrossRef].
- Ponton S., Dupouey J.L., Breda N., and Dreyer E., 2002. Comparison of water use efficiency of seedlings from two sympatric oak species: genotype
environment interactions. Tree Physiol. 22: 413–422 [PubMed].
- R Development Core Team, 2007. R: A language and environment for statistical computing. R Foundation for Statistical Computing, Vienna, Austria. ISBN 3-900051-07-0, URL http://www.R-project.org.
- Reich P.B., Ellsworth D.S., and Walters M.B., 1998. Leaf structure (specific leaf area) modulates photosynthesis-nitrogen relations: evidence from within and across species and functional groups. Funct. Ecol. 12: 948–958 [CrossRef].
- Scotti-Saintagne C., Bodenes C., Barreneche T., Bertocchi E., Plomion C., and Kremer A., 2004. Detection of quantitative trait loci controlling bud burst and height growth in Quercus robur L. Theor. Appl. Genet. 109: 1648–1659 [PubMed] [CrossRef].
- Scotti-Saintagne C., Bertocchi E., Barreneche T., Kremer A., and Plomion C., 2005. Quantitative trait loci mapping for vegetative propagation in pedunculate oak. Ann. For. Sci. 62: 369–374 [CrossRef] [EDP Sciences].
- Sokal R.R. and Rohlf F.J., 2000. In: Biometry, 3rd ed. W.H. Freeman and Company, New York, 887 p.
- Takashima T., Hikosaka K., and Hirose T., 2004. Photosynthesis or persistence: nitrogen allocation in leaves of evergreen and deciduous Quercus species. Plant Cell Environ. 27: 1047–1054 [CrossRef].
- Von Caemmerer S. and Farquhar G.D., 1981. Some relationships between the biochemistry of photosynthesis and the gas exchange of leaves. Planta 153: 376–387 [CrossRef].
- Webb A. and Baker A., 2002. Stomatal biology: new techniques, new challenges. New Phytol. 153: 365–369 [CrossRef].
- Xu Z.H., Saffigna P.G., Farquhar G.D., Simpson J.A., Haines R.J., Walker S., Osborne D.O., and Guinto D., 2000. Carbon isotope discrimination and oxygen isotope composition in clones of the F1 hybrid between slash pine and Caribbean pine in relation to tree growth, water use efficiency and foliar nutrient concentration. Tree Physiol. 20: 1209–1217 [PubMed].
All Tables
Genotype effect estimated for all data (p-level; explained variance) and means, standard deviations (SD) and differences (p-level) between extreme phenotypes “Δ” and “N” (see text for the definition of the phenotypes).
All Figures
|
Figure 1 Relationship between genotype means of 13C isotope discrimination (soluble sugars (Δ13Csugars), starch (Δ13Cstarch) and bulk matter (Δ13Cbulk) and Wi for the phenotypes “Δ”and “N”. Open circles represent genotypes with the phenotype “low Δ”, open squares “low N”, closed circles “high Δ”, closed squares “high N”. The dash line represents the theoretical relationships (Sect. 2.2.) |
| In the text | |
|
Figure 2 Relationship between stomatal conductance and (a) intrinsic water use efficiency (Wi) or (b) light saturated assimilation rate (Asat). Each point represents the mean of a genotype. Symbols as in Figure 1. For the outlier in graph a, only one copy had been available for this genotype (170). |
| In the text | |
|
Figure 3 Relationship between Δ13C of bulk leaf matter (Δ13Cb) and stomatal density (SD). Symbols as in Figure 1. Equation of the geometric mean correlation: Δ13Cb = 10.6 + 0.02 SD, r = 0.68, p = 0.02. Each point represents the mean of a genotype. |
| In the text | |