| Issue |
Ann. For. Sci.
Volume 66, Number 4, June 2009
|
|
|---|---|---|
| Article Number | 412 | |
| Number of page(s) | 10 | |
| DOI | https://doi.org/10.1051/forest/2009014 | |
| Published online | 06 May 2009 | |
Original article
Temporal trends in the foliar nutritional status of the French, Walloon and Luxembourg broad-leaved plots of forest monitoringÉvolution du statut nutritionnel foliaire des placettes de feuillus des réseaux français, wallon et luxembourgeois de suivi des forêts
Mathieu Jonard1*, Frédéric André1, Etienne Dambrine2, Quentin Ponette1 and Erwin Ulrich3
1 Université catholique de Louvain, Faculté d’Ingénierie Biologique, Agronomique et Environnementale, Unité des Eaux et Forêts,
Croix du sud 2/009, 1348 Louvain-la-Neuve, Belgium
2 INRA Centre de Nancy, Biogéochimie des écosystèmes forestiers,
Route d’Amance, 54280 Champenoux, France
3 Office National des Forêts, Département Recherche,
Boulevard de Constance, 77300 Fontainebleau, France
* Corresponding author: This email address is being protected from spambots. You need JavaScript enabled to view it.
Received: 27 August 2008
Accepted: 19 December 2008
• Two decades after the launching of the monitoring program of forest ecosystems in Europe (ICP forests), a unique data set is now available regarding the foliar nutritional status of the main broad-leaved species growing in much-diversified sites (soil, climate).
• This study focuses on the foliar concentration time series (1993 to 2005) of the French (RENECOFOR), Walloon and Luxemburg broad-leaved plots. The aim is to show long-term trends while taking the inter-plot and inter-annual variability into account.
• Two kinds of statistical processing were used to analyze the data on foliar chemistry: principal component analysis (PCAs) and linear mixed models. In general, the main temporal trends reveal a decrease in the foliar P concentration and a decrease in the foliar Ca concentration, except for European beech on acid soils.
• These temporal patterns confirm the trends previously observed and could be explained by the joint actions of several processes that influence tree nutrition in the long term: tree age, N and S deposition, harvesting and climate.
Résumé
• Deux décennies après le lancement du programme de suivi des écosystèmes forestiers en Europe (ICP forests), un jeu de données unique est à présent disponible concernant le statut nutritionnel foliaire des principales essences feuillues implantées dans des stations très diversifies du point de vue du sol et du climat.
• Cette étude se focalise sur les séries chronologiques de teneurs foliaires (1993 à 2005) des placettes de feuillus de France, Wallonie et Luxembourg. L’objectif est de mettre en évidence la tendance à long-terme tout en prenant en compte la variabilité inter-placette et inter-annuelle.
• Deux types de traitements statistiques ont été utilisés pour analyser les données de nutrition foliaire : l’analyse en composantes principales (ACP) et les modèles linéaires mixtes. Globalement, la tendance principale est une diminution généralisée de la teneur foliaire en P and une diminution de la teneur foliaire en Ca, sauf en ce qui concerne le hêtre sur sols acides.
• Ces tendances temporelles confirment celles déjà observées par le passé et pourraient être expliquées par l’action combinée de différents processus influençant la nutrition des arbres à long-terme (vieillissement, dépôts azotés et soufrés, exploitation, fructification).
Key words: Quercus robur / Quercus petraea / Fagus sylvatica / trend analysis / phosphorus
Mots clés : Quercus robur / Quercus petraea / Fagus sylvatica / analyse de tendance / phosphore
© INRA, EDP Sciences, 2009
1. INTRODUCTION
The nutritional status of forest stands can be assessed by chemical analysis of nutrient concentrations in foliar tissues (Marschner, 1995). However, foliar chemistry varies from species to species (Hagen-Thorn et al., 2004) and also depends on tree genotype, developmental stage and social status, and on leaf location within the tree crown (Luyssaert et al., 2002). Foliar nutrient concentrations fluctuate throughout the vegetative period (Le Tacon and Toutain, 1973) and from year to year depending on the climatic conditions (Hippeli and Branse, 1992; Schleppi et al., 2000).
The long-term trends in foliar chemistry reflect tree aging and the environmental effects on tree nutrition, such as the impacts of air pollution and climate change. Nitrogen (N) and sulfur (S) deposition caused by anthropogenic emissions (e.g. fuel combustion, intensive agriculture) may induce or aggravate nutritional imbalances in nutrient-poor forest ecosystems. Although tree nutrient demand augments with increased forest productivity resulting from the fertilizer effect of N deposition (Mellert et al., 2004) and from certain changes in sylvicultural practices and in climate conditions (Lebourgeois et al., 2001), the supply of P and base cations remains generally low in forest soils and is likely to decrease with soil acidification (Adams, 1999).
In order to show long-term nutritional trends, long time series are required. In the past, such data sets were scarce and were obtained, for example, by using the control plots of fertilization or thinning trials (Mellert et al., 2004). Another option consisted in re-sampling stands after a certain time lag (Alfani et al., 2000; Duquesnay et al., 2000); however, this method did not allow researchers to separate the long-term trends from the inter-annual variability. At present, large data sets on forest functioning are available in Europe since forest monitoring has started more than 20 years ago thanks to ICP forests and the European Commission. Based on data analyzed at national level, the temporal variation in foliar chemistry has already been described for several regions (Flückiger and Braun, 1998; Thelin et al., 1998; Luyssaert et al., 2004; 2005). Generally, the temporal pattern is characterized by an increase in foliar N concentration and a decrease in foliar phosphorus (P), calcium (Ca), magnesium (Mg) and potassium (K) concentrations (Duquesnay et al., 2000; Flückiger and Braun, 1998; Luyssaert et al., 2004; Mellert et al., 2004; Thelin et al., 1998).
This study focus on the foliar concentration time series (1993 to 2005) of the French (RENECOFOR), Walloon and Luxemburg broad-leaved plots of the level II network (ICP forests and EC). The aim is to (i) detect any long-term trends while taking the inter-annual and inter-plot variability into account and (ii) propose hypotheses which might explain the temporal variations observed.
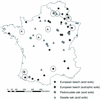 |
Figure 1 Plot location. Plots where deposition and meteorology were measured are surrounded by a circle. |
2. MATERIAL AND METHODS
The data set available for this study comprises 57 monitored plots (level II + Level III) from three countries (France: 50 plots, Belgium-Wallonia: 5 plots, Luxemburg: 2 plots). In France, foliar sampling was carried out every year from 1993 to 1997, again in 1999, 2001 and 2005; in Wallonia, sampling was achieved in three successive years 1996, 1997, 1999, then alternately in 2001, 2003 and 2005; the two Luxemburg plots were sampled every year from 1994 to 1999, then alternately in 2001, 2003 and 2005.
The plots were divided into 4 groups according to tree species and soil pH (acid soils: pH H 2O in the 0–20 cm horizon < 5.5, eutrophic soils: pH > 5.5); the four groups are pedonculate oak on acid soils, sessile oak on acid soils, European beech on acid soils and European beech on eutrophic soils (Fig. 1). Tree species and soil acidity are indeed the two factors that best explained the variability in foliar chemistry between plots (Jonard et al., 2008). The main soil properties of each group are presented in Table I. Regarding the French plots, further details can be obtained on soil types (Brêthes and Ulrich, 1997), soil chemical properties (Ponette et al., 1997) and stand characteristics (Cluzeau et al., 1998).
Selected properties of the 0–20 cm horizon of the various plot groups (standard deviation).
2.1. Leaf sampling
The sampling method, the sample treatments and the chemical analyses were comparable in each country and are described in detail in Ulrich et al. (1994) and in Croisé et al. (1999). Sampling was carried out between 15 July and 31 August. On all plots, branches were taken from the upper third of the crown of 8 dominant trees using a hunting gun. Leaves were then separated from twigs. The individual samples were oven-dried at 40 °C and were pooled per plot. In addition, the dry weight of 100 leaves (oven-dried at 80 °C) was determined.
2.2. Element analyses
Regarding the French and the Luxembourg networks, the elemental composition (P, Ca, Mg, K) of the leaves was determined by ICP spectrometry after combustion in a muffle furnace at 450 °C and ash dissolution with HF (from 1993 to 1995 and in 2005) or after wet digestion with a mixture of HNO3, H2O2 and HF (between 1996 and 2001). Foliar N concentration was determined by the Kjeldahl method. Sulfur was determined by ICP spectrometry after wet digestion with a mixture of HClO4 and HNO3 (Croisé et al., 1999). Concerning the Walloon plots, the elemental composition (P, S, Ca, Mg, K) of the leaves was determined by ICP spectrometry after wet digestion with a mixture of HClO4 and HNO3. Foliar N concentration was determined by the Kjeldahl method between 1996 and 2004 and then with a CN analyzer. For the elements determined by different methods, comparisons ensured the consistency of the data set.
2.3. Additional data
In order to interpret the temporal trends in foliar nutrition, we used additional information on rainfall, air temperature, fruit fall and atmospheric deposition. Measurements of rainfall and air temperature were obtained from the exposed meteorological stations located in the vicinity of the 10 level III plots (Fig. 1). Rainfall was measured weekly using manual rain gauges from 1993 onwards and air temperature was measured hourly with thermocouples as of 1995. The inter-annual variations of rainfall and mean air temperature during the growing season (25 March to 5 October) are described graphically in Figure 2.
 |
Figure 2 Temporal variation of rainfall and mean air temperature during the growing season (25 March to 5 October). |
Acorns and beechnuts were collected in 10 litter traps per plot placed according to a systematic design (interception area of a trap: 0.5 m2) . Litterfall was collected four times per year. The collected samples were air-dried and sorted into leaves, branches and fruits of the dominant tree species. All components were oven-dried at 105 °C during 24 h and weighed. The inter-annual variations of fruit fall between 1993 and 2005 are presented for each plot group in Figure 3.
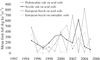 |
Figure 3 Temporal variations of fruit fall for the different groups of plots. |
Atmospheric deposition of N (N_NO3 and N_NH4) and S (S_SO4) was evaluated at the 10 level III plots (Fig. 1) based on throughfall deposition for oak and on throughfall plus stemflow deposition for beech. Throughfall was collected in three gutters (total interception area: 0.85 m2) connected to a polyethylene barrel. Stemflow was collected using flexible troughs (in polyethylene foam) placed around the trunk of two trees per plot and connected to polyethylene barrels. Every week from 1993 to 2005, water volume was determined by measuring the water height in the barrels and a water sample was collected. Throughfall and stemflow samples were stored at 4 °C and pooled together by 4-week periods before processing to chemical analyses.  ,
,  and
and  concentrations were determined by ion chromatography. Annual throughfall/stemflow deposition was calculated by multiplying ion concentrations by throughfall/stemflow volumes of 4-week periods and by summing it over the year. The temporal trends in N and S deposition are presented in Figure 4.
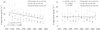 |
Figure 4 Temporal trends in deposition of S (S_SO4) and N (N_NO3 + N_NH4) under oak and beech on acid soils. |
Mean leaf mass and foliar nutrient concentrations of the various plot groups (standard deviation). Groups without common letters are significantly different (ff = 0.05, Tukey multiple comparison test). Threshold values are given for comparison (Bonneau, 1995; Croisé et al., 1999; Van den Burg, 1985; 1990).
2.4. Statistical analyses
Two kinds of statistical processing were used to analyze the temporal pattern of nutrient concentrations (N, S, P, Ca, Mg, K) and the mass of 100 leaves: principal component analysis (PCAs) and linear mixed models.
For each plot group, detrended PCAs were carried out with the SPAD software (version 4.51, CISIA-CERESTA, Paris, France) on the annual foliar concentrations from which the plot mean was first subtracted in order to show the inter-annual variations more precisely.
For all the plot groups, a linear mixed model was used to evaluate the temporal trend (linear fixed effect) as well as the inter-plot and the inter-annual variability (random effects):
 (1)
(1)
 ) reflects the inter-annual variability, θ is the random effect “plot” whose variance (
 ) reflects the inter-plot variability within a group of plots, ε is the residual term and
  is the associated variance. The model was adjusted on the full data set taking all the available years into account and on a restricted data set considering only the years 1993, 1997, 2001 and 2005 in order to get a balanced sampling design and avoid leverage effects; the fitting was carried out with the MIXED procedure of the SAS software (version 9.1; SAS institute Inc., Cary, N.C.). In general, the foliar nutrient concentrations were distributed normally, except the foliar Ca concentration for which the natural logarithm was used to adjust the linear model.
3. RESULTS
3.1. Foliar nutrient status
According to the threshold values mentioned by Croisé et al. (1999) and adapted from Bonneau (1995) and Van den Burg (1985, 1990), the mean foliar N, S and Ca concentrations are above the optimum while the mean foliar P concentration is between the critical and the optimum levels for all broad-leaved groups. The Mg nutrition level is critical for European beech on acid soils; it is above the optimum for the oak groups and just below the optimum for European beech on eutrophic soils. The mean foliar K concentration is at (or above) the optimum for the oak groups and is just above the critical level for the beech groups (Tab. II).
Pedonculate oak on acid soils differs from the other groups by a higher foliar K concentration; sessile oak on acid soils by a lower foliar S concentration; European beech on acid soils by a lower Mg concentration; and European beech on eutrophic soils by a higher foliar Ca concentration (Tab. II).
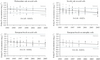 |
Figure 5 Temporal trends in foliar P concentration. Threshold values are from Croisé et al. (1999). |
Temporal linear variations (1993 to 2005) of the foliar concentrations for the various plot groups. The slope sign is given by “+” and “–” and the degree of significance is codified as follows: P < 0.1: (+) or (–), P ≤ 0.05: + or –, P ≤ 0.01: ++ or – –, P 60.001: +++ or – – –.
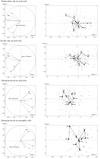 |
Figure 6 Principal component analyses carried out on the foliar concentrations after removal of the plot effect. In the variable representations (left), dashed lines are for illustrative variables; in the individual representations (right), the centers of gravity of the various years (illustrative variable) were positioned and connected to each other. |
3.2. Temporal trends
In most cases, the model fitting provides similar results with both types of data sets (full and restricted), indicating no systematic leverage effects associated with the unbalanced design (Tab. III). As a precaution, we only retain the temporal trends detected with the restricted data set.
The fitting of the model (Eq. (1)) reveals a general decrease in foliar P concentration (Fig. 5), a decrease in the foliar Ca concentration for the oak groups and for European beech on eutrophic soils, a decrease in the foliar N, Mg and K concentrations for sessile oak and an increase of the leaf mass for European beech on acid soils (Tab. III). These temporal trends generally account for less than 15% of the total variability (not shown).
For each plot group, the temporal variations of the foliar nutrient concentrations are also illustrated, using detrended principal component analysis (Fig. 6). To interpret these four principal component analyses, it is useful to look to both representations (variables and individuals) simultaneously. The coordinates of the variables (foliar nutrient concentrations) in their graph represent the correlation of the corresponding variables with the factorial axes. For each plot group, the foliar concentrations of all elements are correlated with each other and with the first factorial axis. This axis accounts for 35 to 48% of the variability and is strongly correlated with the foliar P concentration (Pearson correlation: 0.72 to 0.90). When looking to the relative position of the individuals, a similar temporal pattern is observed for each plot group: the scatter of points moves from year to year along the first axis in a direction opposite to that corresponding to an increase in the foliar nutrient concentrations (Fig. 6). It is worth mentioning that the sign associated with the factorial axes is of no importance to interpret these figures and that only the relative position of the individuals has to be taken into account and interpreted based on the representation of the variables. The foliar mass was included in the principal component analyses as an illustrative variable. Although it cannot be taken into account for the oak groups, this variable is well represented on the factorial plane of the beech groups and is negatively correlated with the foliar concentrations.
3.3. Variance partitioning
The comparison of the total variance with the variances of the random effects indicates that the inter-plot and inter-year variations account for a large part of the total variability (not shown). Regarding the foliar P and Ca concentrations, the variance of the random effect ‘plot’ is generally much higher than the variance of the random effect ‘year’. For the leaf mass and for the N, S, Mg and K concentrations, the plot effect is still generally larger than the year effect; however, the two random effects are often of the same order of magnitude. The residual variance can be divided by the total variance to obtain the proportion of unexplained variability, which amounts on average to 40%.
4. DISCUSSION
In this study, two complementary statistical methods are used to characterize the temporal variations of the foliar concentrations. The linear mixed model enables us to evaluate the significance of the linear trend while accounting for the inter-plot and the inter-annual variability by using random effects. However, there is a drawback to this method because the interactions between nutrients are not taken into account since the model is adjusted independently for each nutrient. In contrast, the principal component analysis illustrates the temporal variation of all foliar concentrations simultaneously, but this technique is mainly descriptive (Schleppi et al., 2000).
As a rule, the main temporal trends detected with these statistical analyses are a general decrease in the foliar P concentration of all the plot groups and a decrease in the foliar Ca concentration of all groups except European beech on acid soils (Tab. III and Figs. 5 and 6). Concerning sessile oak on acid soils, the foliar concentrations of all nutrients except S decrease with time (Tab. III). The nutrients for which temporal changes are significant exhibit a relatively small inter-annual variability; a longer observation period will be necessary to detect the potential trends associated with those nutrients having a larger inter-annual variability.
These temporal patterns confirm the trends previously observed (Duquesnay et al., 2000; Flückiger and Braun, 1998; Luyssaert et al. 2004; Mellert et al., 2004; Thelin et al., 1998) and can be explained by the joint actions of several processes that influence tree nutrition in the long term: tree age, N and S deposition, harvesting and climate.
Leaf nutrient concentrations vary with tree age: older trees have lower foliar macronutrient concentrations than younger ones (Cole and Rapp, 1981; DeBell and Radwan, 1984). The decline in leaf nutrient concentrations with age may be attributed to nutrient storage in stems and branches, which decreases the nutrient availability in the soil. In parallel, increasing internal redistribution reduces the nutrient demands of the trees (Kimmins, 1997). In this study, the magnitude of the decrease in foliar P concentration seems too great to be explained only by tree aging (Fig. 5).
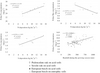 |
Figure 7 Effect of deposition and rainfall on foliar chemistry. |
During the observation period, the annual N deposition in France, Wallonia and Luxemburg remained stable and amounted on average to 10 kg ha−1 y−1 (Fig. 4). In many places, N deposition probably exceeded critical loads and contributed to ecosystem eutrophication (Party et al., 2001). In contrast, S deposition strongly decreased from 12 kg ha−1 y−1 in 1993 to 6 kg ha−1 y−1 in 2005 (Fig. 4); however, the acidifying effect of past S deposition could still be impacting on retentive soils with gradual sulfate desorption (Alewell et al., 1997; Van Breemen et al., 1983; Wesselink et al., 1995).
The atmospheric N and S depositions are likely to affect tree nutrition in different ways (Luyssaert et al., 2005; Pearson and Stewart, 1993). During the first stage of the N saturation process, N-limited forest ecosystems respond to regular N inputs by a higher growth rate (Aber et al., 1998). However, since these forests are generally located on nutrient-poor sites, the increased forest productivity results in dilution effects and leads to nutrient:N imbalances (Mellert et al., 2004). In addition, the higher N availability may also reduce the proportion of carbon allocated to roots (Flückiger and Braun, 1998; Mohren et al., 1986), which intensifies the nutritional stresses. In this study, the hypothesis of N saturation is supported by the fact that foliar N concentration increased with increasing N deposition while foliar Mg concentration decreased (Fig. 7). In contrast, foliar P concentration was not significantly correlated to N or S depositions. Given the limited number of observations (n = 10) and the complexity of the relationships linking deposition and P nutrition, we can however not conclude that foliar P concentration was not affected by deposition.
The increased harvesting intensity that followed the storm of December 1999 a long with the resulting canopy opening could have affected tree nutrition by altering the forest floor (Jonard et al., 2006). Indeed, ground skidding has probably partially buried the forest floor into the mineral soil (Yanai et al., 2003) and the changes in ground climate resulting from canopy opening possibly accelerated litter decomposition (Prescott et al., 2000). The forest floor plays a major role in P nutrition (Jonard et al., submitted). The accumulation of decomposing litter creates a medium with low P-sorption capacity that allows the close coupling of P mineralization and root uptake. A deterioration of the forest floor could limit this biological control on P availability and promote the transfer of P from the forest floor to the underlying mineral horizons where inorganic P in solution is generally low since most of the available P is adsorbed on soil constituents (Compton and Cole, 1998; Northup et al., 1995; Paré and Bernier, 1989a; Wood et al., 1984). In addition, the soil acidification caused by N and S deposition may also reduce P availability in the mineral horizons by increasing the P-fixing capacity of the soil (Mohren et al., 1986; Paré and Bernier, 1989b). In the case of the base cations, the migration from the forest floor to the mineral horizons would also occur (Bonneau et al., 2000) and could lead to losses when combined with soil acidification. Indeed, the base cations released by mineralization are likely to leave the rooting zone accompanied by nitrate (Adams, 1999).
The temporal patterns in foliar nutrition could in theory be partly explained by the climatic variations that directly influence the two processes responsible for nutrient transport towards the roots (diffusion and mass flow). Diffusion is indeed an increasing function of soil water content (Barber, 1995) and mass flow depends closely on tree transpiration regulated by potential evapo-transpiration and soil water reserve (Granier and Breda, 1996). Considering all the plot groups together, a positive relationship was observed between the foliar Ca concentration and the rainfall of the growing season (Fig. 7). Consequently, the decrease in foliar Ca concentration may be partly attributed to the fact that the observation period started with two wet years and finished with three dry years of which one was particularly warm (Fig. 2). Regarding P, no rainfall effect was detected (not shown). Climatic variations can also indirectly affect foliar nutrition due to climate control over fructification. Among others effects, a dry warm summer is known to promote seed production the following year (Overgaard et al., 2007; Piovesan and Adams, 2001). As seed production requires large N and P amounts, translocation from leaves to fruits could occur in case of masting and result in a decrease in foliar N and P concentrations (Yasumura et al., 2006). In this study, a higher seed production was observed in 1995 and 2001 for pedonculate oak, in 2003 for sessile oak and in 1995, 2000, 2002 and 2004 for European beech on acid soils and in 1995, 1999 and 2004 for European beech on eutrophic soils (Fig. 3). Unfortunately, the foliar sampling does not always coincide with the years of higher fructification. Therefore, it was difficult to establish a direct link between the decrease in foliar P and the higher seed production observed at the end of the study period (Fig. 3). In the future, an increased frequency of masting associated with climate changes (Overgaard et al., 2007) could however contribute to alterations in foliar nutrition.
5. CONCLUSIONS
Twenty-three years after the launching of the monitoring program of forest ecosystems in Europe (ICP forests), we now have a unique data set enabling us to analyze the temporal variation (1993 to 2005) of the nutritional status of the main broad-leaved species growing in much-diversified sites in France, Wallonia and Luxembourg.
The temporal patterns observed in this study suggest that foliar nutritional status is deteriorating. However, where Ca is concerned, the temporal trend depends on the inter-annual climatic variations and could probably be reversed after several consecutive wet years. As for P, the temporal pattern is not directly linked to these inter-annual climatic variations and is probably due to increased frequency of masting and/or to disruptions in soil-plant nutritional relationships caused by deterioration of the forest floor and by atmospheric deposition of eutrophic and acidifying compounds. To verify the hypotheses proposed and evaluate their respective contributions, we think that mechanistic modeling approaches would be worthwhile. In parallel, the continuation of forest monitoring is necessary to confirm the trends already observed and to detect new ones.
Acknowledgments
This study was funded by the research department of the National Forest Office in France (ONF). We would like to thank L. Augusto, M. Bonneau, L. Croisé, S. Luyssaert, M. Nicolas and M. Saerens for helpful discussions and valuable advice. We also express our thanks to F. Herman and M. Lanier for managing the databases.
References
- Aber J., McDowell W., Nadelhoffer K., Magill A., Berntson G., Kamakea M., McNulty S., Currie W., Rustad L., and Fernandez I., 1998. Nitrogen saturation in temperate forest ecosystems. Bioscience 48: 921–934 [CrossRef].
- Adams M.B., 1999. Acidic deposition and sustainable forest management in the central Appalachians, USA. For. Ecol. Manage. 122: 17–28 [CrossRef].
- Alewell C., Bredemeier M., Matzner E., and Blanck K., 1997. Soil solution response to experimentally reduced acid deposition in a forest ecosystem. J. Environ. Qual. 26: 658–665.
- Alfani A., Baldantoni D., Maisto G., Bartoli G., and Virzo de Santo A., 2000. Temporal and spatial variation in C, N, S and trace element contents in the leaves of Quercus ilex within the urban area of Naples. Environ. Pollut. 109: 119–129 [PubMed] [CrossRef].
- Barber S.A., 1995. Soil Nutrient Bioavailability: a mechanistic approach, John Wiley & Sons, New York, 414 p.
- Bonneau M., 1995. Fertilisation des forêts dans les pays tempérés. ENGREF, Nancy, 367 p.
- Bonneau M., Belkacem S., Nys C., Ranger J., Gelhaye D., Lefèvre Y., and Humbert D., 2000. Evolution d'un sol forestier acide des Vosges sur une période de 10 ans. Observatoire de la Qualité des Sols du DONON. Etude et Gestion des Sols 7: 99–118.
- Brêthes A. and Ulrich E., 1997. RENECOFOR – Caractéristiques pédologiques des 102 peuplements du réseau. Office national des forêts, département des recherches techniques, 573 p.
- Cluzeau C., Ulrich E., Lanier M., and Garnier F., 1998. RENECOFOR – Interprétation des mesures dendrométriques de 1991 à 1995 des 102 peuplements du réseau. Office national des forêts, Département des recherches techniques, 309 p.
- Cole D.W. and Rapp M., 1981. Elemental cycling in forest ecosystems, dynamic properties of forest ecosystems, Reichle D.E. (Ed.), Cambridge University Press, Cambridge, UK, pp. 341–409
- Compton J.E. and Cole D.W., 1998. Phosphorus cycling and soil P fractions in Douglas-fir and red alder stands. For. Ecol. Manage. 110: 101–112 [CrossRef].
- Croisé L., Cluzeau C., Ulrich E., Lanier M., and Gomez A., 1999. RENECOFOR – Interprétation des analyses foliaires réalisées dans les 102 peuplements du réseau entre 1993 et 1997 et premières évaluations interdisciplinaires. Office national des forêts, Département recherche et développement, 413 p.
- DeBell D.S. and Radwan M.A., 1984. Foliar chemical concentrations in red alder stands of various ages. Plant Soil 77: 391–394 [CrossRef].
- Duquesnay A., Dupouey J.L., Clement A., Ulrich E., and Le Tacon F., 2000. Spatial and temporal variability of foliar mineral concentration in beech (Fagus sylvatica) stands in northeastern France. Tree Physiol. 20: 13–22 [PubMed].
- Flückiger W. and Braun S., 1998. Nitrogen deposition in Swiss forests and its possible relevance for leaf nutrient status, parasite attacks and soil acidification. Environ. Pollut. 102: 69–76 [CrossRef].
- Granier A. and Bréda N., 1996. Modeling canopy conductance and stand transpiration of an oak forest from sap flow measurements. Ann. Sci. For. 53: 537–546 [CrossRef].
- Hagen-Thorn A., Armolaitis K., Callesen I., and Stjernquist I., 2004. Macronutrients in tree stems and foliage: a comparative study of six temperate forest species planted at the same sites. Ann. For. Sci. 61: 489–498 [CrossRef] [EDP Sciences].
- Hippeli P. and Branse C., 1992. Veränderungen der nährelementkonzentrationen in den nadeln mittelalter kiefernbestände auf pleistozänen sandstandorten brandeburgs in den jahren 1964 bis 1988. Forstwiss. Centralbl. 111: 44–60 [CrossRef].
- Jonard M., Misson L., and Ponette Q., 2006. Long-term thinning effects on the forest floor and the foliar nutrient status of norway spruce stands in the Belgian Ardennes. Can. J. For. Res. 36: 2684–2695 [CrossRef].
- Jonard M., Ulrich E., Giot-Wirgot P., and Dambrine E., 2008. RENECOFOR – Facteurs explicatifs de la variabilité et évolution temporelle de la nutrition foliaire dans les réseaux de suivi à long terme des écosystèmes forestiers de France (RENECOFOR), de Belgique (Wallonie) et du Grand-Duché de Luxembourg (période 1993–2005). Office national des forêts, direction technique et commercial Bois, 67 p.
- Jonard M., Augusto L., Morel C., Achat D., and Saur E., 2009. Forest floor contribution to P nutrition: experimental data. Ann. For. Sci. 66: in press.
- Kimmins J.P., 1997. Forest ecology: a foundation for sustainable forest management, 2nd ed., Prentice and Hall, Upper Saddle River, New Jersey, 596 p.
- Lebourgeois F., Granier A., and Bréda N., 2001. Une analyse des changements climatiques régionaux en France entre 1956 et 1997. Réflexions en terme de conséquences pour les écosystèmes forestiers. Ann. For. Sci. 58: 733–754.
- Le Tacon F. and Toutain F., 1973. Variations saisonnières et stationnelles de la teneur en éléments minéraux des feuilles de hêtre (Fagus sylvatica) dans l'est de la France. Ann. Sci. For. 30: 1–29 [CrossRef].
- Luyssaert S., Raitio H., Vervaeke P., Mertens J., and Lust N., 2002. Sampling procedure for the foliar analysis of deciduous trees. J. Environ. Monitor. 4: 858–864 [CrossRef].
- Luyssaert S., Sulkava M., Raitio H., and Hollmén J., 2004. Evaluation of forest nutrition based on large-scale foliar surveys: are nutrition profiles the way of the future? J. Environ. Monitor. 6: 160–167 [CrossRef].
- Luyssaert S., Sulkava M., Raitio H., and Hollmén J., 2005. Are N and S deposition altering the mineral composition of Norway spruce and Scots pine needles in Finland ? Environ. Pollut. 138: 5–17 [CrossRef].
- Marschner H., 1995. Mineral nutrition of higher plants. 2nd ed., Academic Press, London, 889 p.
- Mellert K.H., Prietzel J., Straussberger R., and Rehfuess K.E., 2004. Long-term nutritional trends of conifer stands in Europe: results from the RECOGNITION project. Eur. J. For. Res. 123: 305–319.
- Mohren G.M.J., Van Den Burg J., and Burgen F.W., 1986. Phosphorus deficiency induced by nitrogen input in Douglas fir in the Netherlands. Plant Soil 95: 191–200 [CrossRef].
- Northup R.R., Dahlgren R.A., and Yu Z., 1995. Intraspecific variation of conifer phenolic concentration on a marine terrace soil acidity gradient; a new interpretation. Plant Soil 171: 255–262.
- Overgaard R., Gemmel P., and Karlsson M., 2007. Effect of weather conditions on mast year frequency in beech (Fagus sylvatica L.) in Sweden. Forestry 80: 553–563.
- Paré D. and Bernier B., 1989a. Origin of the phosphorus deficiency observed in declining sugar maple stands in the Quebec Appalachians. Can. J. For. Res. 19: 24–34 [CrossRef].
- Paré D. and Bernier B., 1989b. Phosphorus-fixing potential of Ah and H horizons subjected to acidification. Can. J. For. Res. 19: 132–134 [CrossRef].
- Party J.P., Probst A., Thomas A.L., and Dambrine E., 2001. Calcul et cartographie des charges critiques azotées en France: application de la méthode empirique. Critical loads for nutrient nitrogen: calculations and mapping by empirical method for France. Pollution Atmosphérique 172: 531–544.
- Pearson J. and Stewart G.R., 1993. Tansley review No. 56. The deposition of atmospheric ammonia and its effects on plants. New Phytol. 125: 283–305.
- Piovesan G. and Adams J.M., 2001. Masting behaviour in beech: linking reproduction and climatic variation. Can. J. Bot. 79: 1039–1047 [CrossRef].
- Ponette Q., Ulrich E., Brêthes A., Bonneau M., and Lanier M., 1997. RENECOFOR – Chimie des sols dans les 102 peuplements du réseau. Office national des forêts, Département des recherches techniques, 427 p.
- Prescott C.E., Blevins L.L., and Staley C.L., 2000. Effects of clear-cutting on decomposition rates of litter and forest floor in forests of British Columbia. Can. J. For. Res. 30: 1751–1757 [CrossRef].
- Schleppi P., Tobler L., Bucher J.B., and Wyttenbach A., 2000. Multivariate interpretation of the foliar chemical composition of Norway spruce (Picea abies). Plant Soil 219: 251–262 [CrossRef].
- Thelin G., Rosengren-Brinck U., Nihlgard B., and Barkman A., 1998. Trends in needle and soil chemistry of Norway spruce and Scots pine in South Sweden 1985–1994. Environ. Pollut. 99: 149–158 [PubMed] [CrossRef].
- Ulrich E., Adrian M., and Lanier M., 1994. Manuel de référence No. 6
pour l'échantillonnage foliaire, la préparation des échantillons
et l'analyse, 2
 version, juin 1994. O.N.F.,
département des recherches techniques, D.T.C. 5 (Fontainebleau), 43 p.
version, juin 1994. O.N.F.,
département des recherches techniques, D.T.C. 5 (Fontainebleau), 43 p.
- Van Breemen N., Mulder J., and Driscoll C.T., 1983. Acidification and alkalinization of soils. Plant Soil 75: 283–308 [CrossRef].
- Van den Burg J., 1985. Foliar analysis for determination of tree nutrient status: a compilation of literature data. Report No. 414, Rijksinstituut voor onderzoek in de bos en landschapsbouw “De Dorschkamp”, Wageningen, 615 p.
- Van den Burg J., 1990. Foliar analysis for determination of tree nutrient status: a compilation of literature data 2. Literature 1985–1989. Report No. 591, “De Dorschkamp” Institute for forestry and urban ecology, Wageningen, The Netherlands, 220 p.
- Wesselink L.G., Meiwes K.J., Matzner E., and Stein A., 1995. Long-term changes in water and soil chemistry in spruce and beech forests, Solling, Germany. Environ. Sci. Technol. 29: 51–58 [CrossRef].
- Wood T., Bormann F.H., and Voigt G.K., 1984. Phosphorus cycling in a northern hardwood forest: Biological and chemical control. Science 223: 391–393 [PubMed] [CrossRef].
- Yasumura Y., Hikosaka K., and Hirose T., 2006. Resource allocation to vegetative and reproductive growth in relation to mast seeding in Fagus crenata. For. Ecol. Manage. 229: 228–233 [CrossRef].
- Yanai R.D., Currie W.S., and Goodale C.L., 2003. Soil carbon dynamics after forest harvest: an ecosystem paradigm reconsidered. Ecosystems 6: 197–212 [CrossRef].
All Tables
Selected properties of the 0–20 cm horizon of the various plot groups (standard deviation).
Mean leaf mass and foliar nutrient concentrations of the various plot groups (standard deviation). Groups without common letters are significantly different (ff = 0.05, Tukey multiple comparison test). Threshold values are given for comparison (Bonneau, 1995; Croisé et al., 1999; Van den Burg, 1985; 1990).
Temporal linear variations (1993 to 2005) of the foliar concentrations for the various plot groups. The slope sign is given by “+” and “–” and the degree of significance is codified as follows: P < 0.1: (+) or (–), P ≤ 0.05: + or –, P ≤ 0.01: ++ or – –, P 60.001: +++ or – – –.
All Figures
|
Figure 1 Plot location. Plots where deposition and meteorology were measured are surrounded by a circle. |
| In the text | |
|
Figure 2 Temporal variation of rainfall and mean air temperature during the growing season (25 March to 5 October). |
| In the text | |
|
Figure 3 Temporal variations of fruit fall for the different groups of plots. |
| In the text | |
|
Figure 4 Temporal trends in deposition of S (S_SO4) and N (N_NO3 + N_NH4) under oak and beech on acid soils. |
| In the text | |
|
Figure 5 Temporal trends in foliar P concentration. Threshold values are from Croisé et al. (1999). |
| In the text | |
|
Figure 6 Principal component analyses carried out on the foliar concentrations after removal of the plot effect. In the variable representations (left), dashed lines are for illustrative variables; in the individual representations (right), the centers of gravity of the various years (illustrative variable) were positioned and connected to each other. |
| In the text | |
|
Figure 7 Effect of deposition and rainfall on foliar chemistry. |
| In the text | |