Free Access
Figure 4
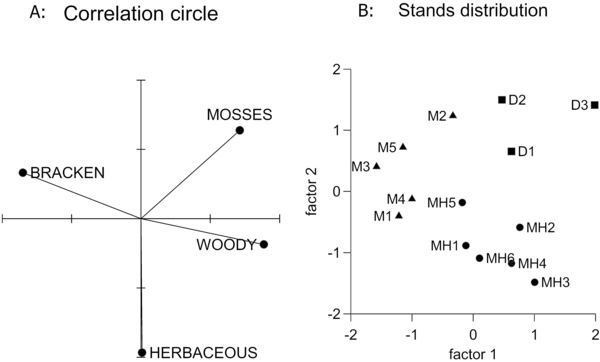
Principal component analysis using the biomass data per species group for the 14 sampled sites. (A) Correlation circle for axes 1 and 2, accounting for 50.4 and 37.1% of the total inertia. (B) Projection of the sampled sites upon the factorial plane 1-2. (•) Mesohygric moorland sites, (▴) mesic sites, (▪) dry moorland sites.