Free Access
Figure 5
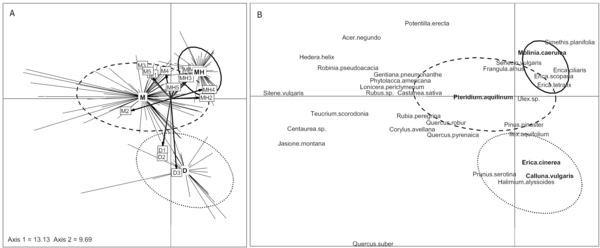
Factorial correspondence analysis using the abundance notations per species for the Pontenx 145 sites. (A) Projection of the sites upon the factorial plane 1-2 (accounting for 13.13 and 9.69% of the total inertia). (—–) MH mesohygric moorland sites, (– –) M mesic sites, (• • •) D dry moorland sites. Biomass sampling sites projected as additional data are presented using their stand code. (B) Projection of the species.