Free Access
Figure 1
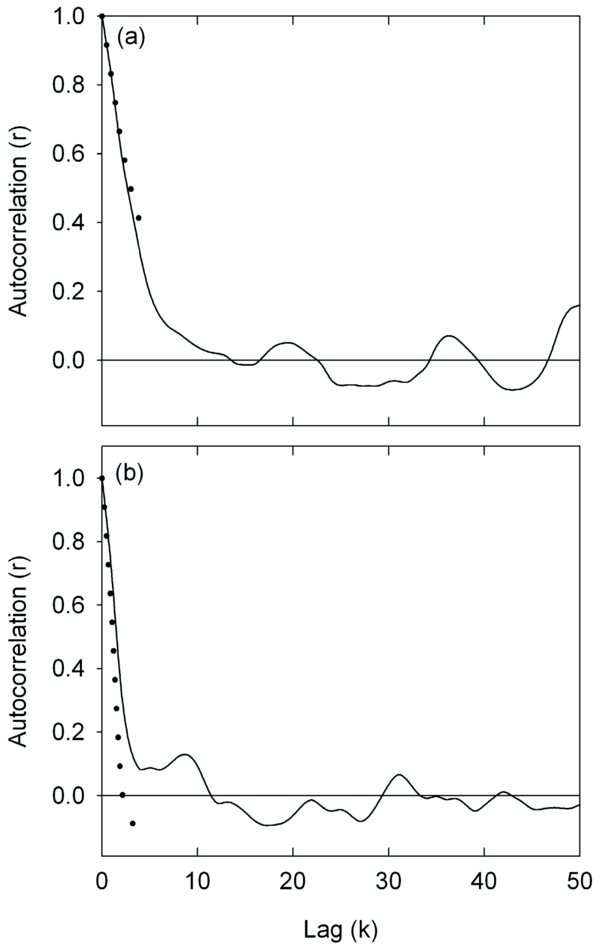
Examples of directional correlograms on the x-axis (solid line) and on the y-axis (broken line). Isotropy was assumed when both correlograms overlapped. (a) Isotropy; (b) anisotropy. Since transects were five 10-cm squares wide, the maximum lag in the correlogram following the y-axis direction was five (0.5 m).