Free Access
Figure 3

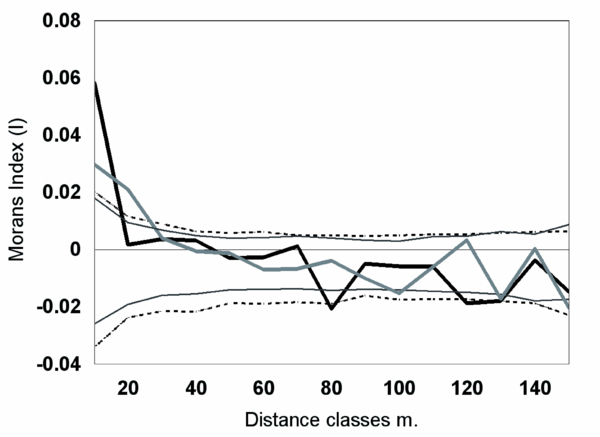
Spatial autocorrelation calculated by Morans Index among adult samples of Q. petraea (grey) and Q. robur (black). 95% confidence intervals based on 5000 permutations are presented as dotted black line for Q. robur and thin grey line for Q. petraea.


