Free Access
Figure 7

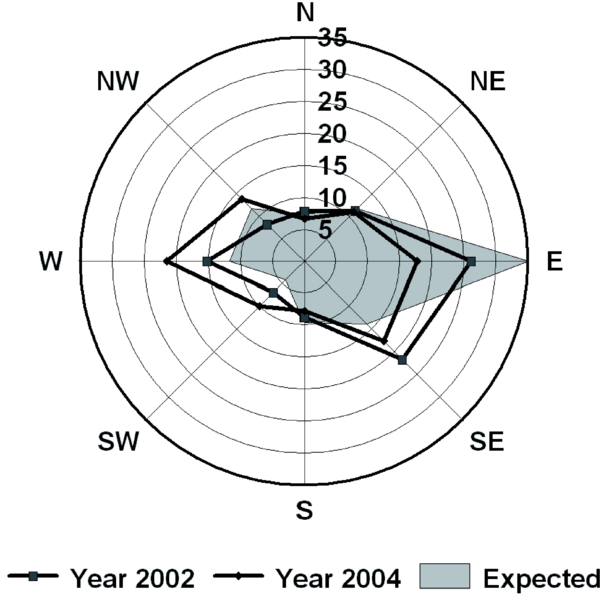
Circular histogram showing the expected and observed distribution of pollination events according to direction of pollen flow averaged over the progeny arrays of all sampled mother trees in Velling forest in years 2002 and 2004. The diagram shows the relative distribution in percent. The ‘expected’ category reflects the averaged frequency distribution of potential fathers around the sampled mother trees.


