Free Access
Figure 2
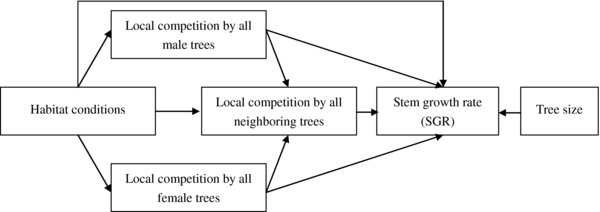
Path analysis diagram showing the influence of local competition from neighboring trees, tree size and environment factors on the growth rates of reproductive F. mandshurica. The single-directional arrows define the cause-and-effect relationships in the path diagram for the causal model. Residual errors associated with each endogenous variable in the model are not shown. Tree size is expressed as stem diameter at breast height measured in 2005. Stem growth rates are expressed as the radius increment at breast height from 2003 to 2007.