| Issue |
Ann. For. Sci.
Volume 66, Number 8, December 2009
|
|
|---|---|---|
| Article Number | 813 | |
| Number of page(s) | 12 | |
| DOI | https://doi.org/10.1051/forest/2009067 | |
| Published online | 25 November 2009 | |
Opinion
Deforestation and forest degradation in Papua New Guinea
Déboisement et dégradation des forêts en Papouasie-Nouvelle-Guinée
1
Resource Management in Asia-Pacific Program, Research School of Pacific and Asian Studies, Australian National University,
Canbura
Australia
2
Department of Forest and Ecosystem Science, Melbourne School of Land and Environment, University of Melbourne,
Australia
3
Department of Human Geography, Research School of Pacific and Asian Studies, Australian National University,
Canberra
Australia
4
Formerly Division of Water and Land Resources, Commonwealth Scientific and Industrial Research Organisation,
Canberra
Australia
* Corresponding author:
This email address is being protected from spambots. You need JavaScript enabled to view it.
Received:
15
December
2008
Accepted:
26
May
2009
Abstract
• The Government of Papua New Guinea (PNG) has played a prominent part in recent negotiations for “rainforest nations” to be compensated for reducing greenhouse gas emissions from deforestation or forest degradation (DFD).
• A new report “The State of the Forests of Papua New Guinea” claims that rates of DFD in PNG are much higher than have previously reported. It suggests more than half of PNG’s remaining forests will have disappeared or be damaged beyond recovery by 2021.
• We argue that this claim is incorrect. The report overestimates the area of intact primary forest in 1972 and the impact of traditional land use practices on forest cover. Much of what the RSLUP report considers as deforestation is part of a cycle of traditional clearance for farming, fallow and regrowth that has been occurring for hundreds of years.
• The assumption that areas impacted by harvesting or shifting cultivation will inevitably degrade and become non-forest is also not supported by observation of cutover forest in PNG. A considerable proportion of cutover forest areas will recover carbon stocks after harvesting.
• It is argued that traditional land use practices and forest recovery processes need to be considered in assessing greenhouse gas emissions from deforestation and degradation in countries with complex land use histories such as PNG.
Résumé
• Le Gouvernement de Papouasie-Nouvelle-Guinée (PNG) a joué un rôle important dans les récentes négociations pour que “les pays à forêt tropicale humide” soient indemnisés pour la réduction des émissions de gaz à effet de serre provenant de la déforestation ou la dégradation des forêts (DFD).
• Un nouveau rapport “L’État des forêts de Papouasie-Nouvelle Guinée” affirme que les taux de DFD en PNG sont nettement plus élevés que précédemment signalés. Il suggère que plus de la moitié des forêts de PNG auront disparu ou seront endommagées au-delà de la récupération d’ici 2021.
• Nous sommes d’avis que cette affirmation est erronée. Le rapport surestime la surface de la forêt primaire intacte, en 1972, et l’impact des pratiques traditionnelles d’utilisation des terres sur le couvert forestier. Une partie importante de ce que le rapport RSLUP considère comme de la déforestation fait partie d’un cycle traditionnel de dégagement pour l’agriculture, la jachère et la repousse ce qui s’est produit pendant des centaines d’années.
• L’hypothèse que les zones touchées par l’exploitation forestière ou la culture itinérante vont inévitablement se dégrader et ne pas devenir de la forêt n’est pas non plus soutenue par l’observation des déboisement en PNG. Une proportion considérable des zones forestières déboisées récupérera des stocks de carbone après la récolte.
• Il est fait valoir que l’utilisation traditionnelle des terres et les processus de régénération forestières doivent être pris en considération dans l’évaluation des émissions de gaz à effet de serre résultant du déboisement et des dégradations dans les pays ayant une histoire complexe de l’utilisation des terres comme la Papouasie-Nouvelle-Guinée.
Key words: rainforest / remote sensing / carbon / forest dynamics
Mots clés : forêt tropicale humide / télédétection / carbone / dynamique forestière
© INRA, EDP Sciences, 2009
1. INTRODUCTION
The United Nations Environment Program has named Kevin Conrad and the Coalition for Rainforest Nations (CRN), as one of seven “Champions of the Earth” in 2009. Conrad is not only the Executive Director of the CRN, but also represents the Government of Papua New Guinea (PNG) as its Special Envoy for Climate Change. In both of these capacities, he has made a strong case for “rainforest nations” like PNG to receive compensation from the international community for reducing greenhouse gas emissions from deforestation and forest degradation (DFD).
Recent international debate about the merits of adding such a mechanism to the UN Framework Convention on Climate Change (UNFCCC) has added a new sense of urgency to the longer scientific debate about how to measure current rates of DFD and the volume of greenhouse gas emissions from this source (IPCC, 2000; 2003; Kanninen et al., 2007; Malhi and Phillips, 2005). According to recent estimates, emissions from what the UNFCCC calls “land use change and forestry” are roughly 17–18% of total global emissions (Baumert et al., 2005; IPCC, 2007). However, the validity of these estimates depends on prior measurements of the global rate of tropical deforestation which are themselves open to question (Fearnside and Laurance, 2004; Grainger, 2008; Ramankutty et al., 2007). Whatever the true figures, support for the CRN’s position is now partly based on an economic argument that the cost of reducing emissions from this source is lower than the cost of other mitigating measures (Chomitz, 2007; Stern, 2007).
Nevertheless, in order to claim some credit for reducing emissions from any source, it is first necessary to establish the baseline against which a future reduction can be measured with some degree of reliability and objectivity (Brown et al., 2007; IPCC, 2000). This problem of measurement is compounded by a mixture of scientific and political arguments about what is considered to be “forest” and what is meant by words like “deforestation” and “degradation” (Schoene et al., 2007). The UN Food and Agriculture Organisation (FAO) has been seeking to establish an international consensus on such definitional questions since it first began to collect information from member countries for the purpose of its periodic Global Forest Resource Assessments in 1947 (FAO, 2003; Holmgren and Persson, 2003). Meanwhile, the perceived urgency of climate change as a policy issue has encouraged a variety of non-governmental organisations around the world to engage in their own assessments of the relationship between DFD and the global carbon cycle, using varying definitions and standards of measurement.
Even if the problems of definition and measurement are solved by international negotiation and agreement, a scheme to reward countries which can demonstrate a reduced level of emissions from DFD might still entail a form of moral hazard. This term is generally applied in the context of insurance or contract arrangements where the prospect that a party insulated from risk may behave differently from the way it would behave if it were fully exposed to the risk. In this case “countries might be tempted to increase deforestation to obtain a higher target” (Chomitz, 2007: 206). In other words, there could be a perverse incentive to accelerate the current rate of DFD in order to create a bigger opportunity to reduce it later and claim a larger reward for doing so.
A second risk is that the rights or interests of local or indigenous communities of “rainforest people” might be expropriated by their own governments in order to facilitate the sale of reduced forest carbon emissions to foreign investors (Colchester et al., 2006; Kanninen et al., 2007). In this case, governments may have a vested interest in exaggerating the role of activities like shifting cultivation in driving the DFD process in order to claim carbon credits for taking punitive action against the shifting cultivators. This invites us to consider a third problem associated with the issues of definition and measurement. That is, the prospect of financial compensation provides an incentive for countries to construct accounts which exaggerate the actual rate of DFD, in the hope of claiming a reward for reducing emissions which did not actually occur. In this case, national governments and local communities might even develop a common interest in making such exaggerated claims if they can work out a way to share the rewards for doing so (Luttrell et al., 2007).
In this paper, we review current estimates and drivers of deforestation and reductions in forest cover that cause a reduction in carbon stock in PNG forests. The definition of deforestation is relatively straightforward and we use that term where appropriate. Given the complications associated with defining “forest degradation” we use the more neutral term “forest modification” to consider processes that do not result in complete loss of forest cover.
2. ESTIMATES OF FOREST CHANGE IN PNG
The mostly recently presented “evidence” of deforestation and forest modification is a report from the Remote Sensing and Land-Use Project (RSLUP) implemented by the University of PNG with funding from a range of international sources. Its publication on 2 June 2008 was accompanied by a press release distributed through the Australian Science Media Centre that was reported in dozens of newspapers and broadcasts around the world. The most alarming (and therefore widely reported) statement in this press release was that “83 percent of the country’s accessible forest (and 53% of its total forested area) will be gone or severely damaged” by 2021 (UPNG, 2008: 1). Another press release from the same source simply said that “half of PNG’s forests will be gone” by 2021. Parts of this report were subsequently published in the journal Biotropica (Shearman et al., 2009).
The argument Shearman et al. use to support these contentions is based on the following estimates and assumptions regarding the conditions and trends in forest cover in PNG:
There were 380000 km2 of “intact forest” in PNG in 1972, which covered 82% of PNG’s land area (Shearman et al., 2008, p. 25).
Of this area, 332276 km2 (87%) was “intact primary rainforest”, while the rest was divided between swamp forest, dry evergreen forest, and mangroves (ibid.: 25).
In 2002, PNG’s “primary forest area” had decreased to 253323 km2, suggesting that 23.8% of the area existing in 1972 had been cleared or degraded at an average rate of 0.79% per annum (ibid.: 13).
The annual rate of intact forest loss increased over this 30-year period, with the result that 1.41% (or 4685 km2) of the original “primary forest area” was cleared or degraded in 2002 (ibid.: 28).
Extrapolation of this trend indicates that 1.71% (or 5682 km2) of the original “primary forest area” is now being cleared or degraded each year (ibid.: 28).
If this rate of change continues then half of that forest area will have disappeared or be damaged beyond repair by 2024.
If the rate of change accelerates as a result of continued population growth and the further expansion of commercial logging activities, “half of PNG’s forests will be gone” by 2021.
2.1. The extent of forest cover in 1972
The RSLUP report contains an element of semantic confusion about the definition and measurement of “primary forests”. In the report this term mostly refers to “rainforests” and not to other forest types (swamp forest, dry evergreen forest, and mangroves). The latter were considered to have made up roughly 10% of the total forest cover in 1972 and are still mostly “intact”. In 2002, swamp forest was said to cover 34090 km2, dry evergreen forest 7503 km2, and mangroves 5749 km2 – a combined area of 47342 km2 of forest which is not “rainforest” (ibid.: 13). The only figures given for the extent of such forest types in 1972 are rough estimates which suggest that there has been no measurable change at all (ibid.: 25). It seems that the techniques used to identify land cover change in this study could not detect changes in these three forest types anyway (ibid.: 84). The prediction that “half the remaining forests” will be gone by 2021 is thus a prediction about “primary rainforests”, not a prediction about the total forest area (see Tab. I).
RSLUP calculations of rainforest loss in PNG, 1972–2002.
Having resolved this problem, we still find that the argument presented in the RSLUP report is based on an overestimate of the extent of primary forest cover in 1972. The claim that “rates of DFD in PNG are much higher than had previously been thought” refers to the previous estimates made in the Forest Inventory Mapping System (FIMS) produced for the PNG Forest Authority in 1996. Production of this database was funded by the Australian government as a component of PNG’s National Forestry and Conservation Action Program, and has since formed the basis of the Forest Authority’s reports to the FAO’s Global Forest Resource Assessments (Ambia, 2005).
Comparison of these two datasets shows they are in substantial agreement about the extent of the area which the RSLUP calls “commercially accessible forest” and the FIMS described as “potential production forest” (Tab. II). However, they differ considerably in the estimates of total forest cover. The FIMS estimate of “total gross forest area” included all four forest types discussed above which the RSLUP report included in its 380000 km2 of “primary forest”. The FIMS excluded 6050 km2 of mangroves from the estimate of “total gross forest area”. The FIMS also excluded 22503 km2 of swamp forest, 10629 km2 of dry seasonal forest and some small areas of alpine, littoral and seral forest to arrive at the “adjusted” estimate of gross forest area. This could reasonably be described as the FIMS estimate of “primary rainforest area”, much lower than the RSLUP estimate. The RSLUP report suggests that 72% of PNG’s land area was covered by this type of forest in 1972, while the FIMS figure was closer to 63% in 1975 – a difference of almost 40000 km2.
Different calculations of forest cover in PNG, 1972–1975. Figures are presented in square kilometres as we consider this reflects the appropriate level of accuracy for the scale at which this data was collected.
The explanation for this difference is certainly not to be found in anything which transpired between 1972 and 1975 because both sets of calculations are primarily derived from interpretations of the same “Skaipiksa” series of aerial photographs taken by the Royal Australian Air Force during this period. Cartographers in the Royal Australian Army Survey Corps used these photographs to produce the 1:100000 (T601) topographic map series which covers the whole of PNG. The maps in this series contain a relatively simple indication of the spatial extent of different types of vegetation, including three types called “rain forest”, “medium forest” and “secondary growth”. The RSLUP report defines the area covered by “intact primary rainforest” in 1972 as a combination of all the areas shown to be covered by one or other of these three types of vegetation on the topographic maps. All these areas “were assumed to be primary forest as levels of commercial logging were comparatively low prior to this time” (Shearman et al., 2008: 103). In other words, the authors argue that secondary growth can only be caused by commercial logging and not by any other form of activity.
The explanation for the difference lies in the use of two different datasets derived from the same aerial photograph series. By the time the photographs were taken, a team of scientists from the Australian Commonwealth Scientific and Industrial Research Organisation (CSIRO) had already been working for several years on the collection of data that would later be incorporated into a spatial database known as the PNG Resource Information System (PNGRIS). At the core of this database is a division of PNG’s land area into 4566 “Resource Mapping Units” (RMUs) distinguished from each other by one or more of six variables – landform, rock type, altitude, relief, inundation, and mean annual rainfall (Bellamy and McAlpine, 1995). Evidence from the Skaipiksa photographs and an earlier series of aerial photographs was combined with extensive field surveys to establish the boundaries of these units and then to determine the type of vegetation and the degree of “land use intensity” present in each of them. Field surveys were carried out over a period of 20 years (1953–1972) and covered 40% of the land area of PNG. Members of the CSIRO team also published summary national maps of “vegetation” (Paijmans, 1975), “agricultural land use” (Saunders, 1993a) and “forest resources” (Saunders, 1993b) at a scale of one to a million. The last of these three maps (itself derived from the first two maps) informed a “rapid appraisal” of PNG’s forest resources that was incorporated into PNGRIS at the PNGRIS scale of 1:500000. The FIMS dataset was then established at the finer scale of 1:100000, first by reinterpretation of the original air photography and then by analysis of 1996 Landsat TM imagery obtained at a scale of 1:250000, supplemented by rapid ground and air surveys (Hammermaster and Saunders, 1995; McAlpine and Quigley, 1998). At the core of this new dataset was a subdivision of those RMUs which were predominantly covered by natural vegetation into roughly 14000 “Forest Mapping Units” (FMUs). Each of these polygons was assigned a dominant and a sub-dominant vegetation type (occasionally two sub-dominant types), and those dominated by “forests” were classified according to forest type, tree species composition, and the extent of visible human disturbance. Three of the PNGRIS variables – landform, relief, and inundation – were then used to define the physical constraints to logging which enabled the “potential production forest area” to be distinguished from the “adjusted gross forest area” (Tab. II). Potential production area was additionally defined (by the PNG Forest Authority) as forest with a minimum of 15 cubic metres per hectare gross volume of tree species with a minimum of 50 cm DBH (diameter at breast height) and a minimum log length of 5 m (Hammermaster and Saunders, 1995).
The authors of the RSLUP report claim that the topographic map series is a better indicator of forest cover in the early 1970s than the maps produced by the CSIRO team when they constructed the FIMS baseline between 1993 and 1995. Indeed, they make the quite startling claim that “suitably accurate datasets from the 1970s independent of our own 1972 map do not exist” (Shearman et al., 2008: 115). The basis of this claim is unclear, but may consist in a belief that the vegetation classification on the topographic maps was superior in capturing the detail visible on what is said to have been “very high resolution (1–2 m) stereo aerial photography”(ibid.: 103).
The average scale of the Skaipiksa photographs was 1:110000 – similar to the scale of the maps that were derived from them – and it is certainly not possible to distinguish village houses on these photographs, so one could hardly say that they have a resolution of 1–2 m. It was no easy matter to determine patterns of vegetation and land use from these photographs, and the task was well beyond the competence of the military cartographers who produced the topographic map series. They sought advice from members of the CSIRO team, and John Saunders provided them with a very simple classification of forest types with examples of each one taken from the aerial photography. Their application of this scheme in production of the topographic map series is nowhere near as accurate as the map later produced by Saunders himself, let alone the mapping component of the FIMS dataset. When the CSIRO team came to produce the FIMS dataset in the 1990s, they complemented a new stereo interpretation of the Skaipiksa series by reference to the earlier (CAJ) series of aerial photographs which had informed their regional survey work from 1953 to 1972. The CAJ series photographs were of higher quality and finer scale (1:50000) than the Skaipiksa series, but if these earlier photographs had been used as the sole basis for the new round of vegetation mapping, there would have been a fourfold increase in the number of stereo pairs that would have been required, and at least a doubling of the time if would have taken to complete the work.
Many areas of significant land use intensity which are excluded from the FIMS “gross forest area” in 1975 were wrongly classified by the military cartographers as “rain forest” or “medium forest”, while areas shown on the topographic maps as “secondary growth” would nearly all have been excluded because they really were areas of significant disturbance, and even the military cartographers could see that. Comparison of the topographic map series with the PNGRIS and FIMS datasets suggests that more than 20000 km2 of land shown as “medium forest” on the topographic maps was excluded from the FIMS “gross forest area” because of the evidence of significant land use intensity. So what we are dealing with here are two different sets of assumptions about what constituted a “primary forest” in the early 1970s, and two different ways of interpreting aerial photography to determine the extent of primary forest cover.
2.2. Conversion and regeneration rates
RSLUP attribution of DFD to different human activities, 1972–2002.
The second assumption behind the calculations made in the RSLUP report can be broken down into a number of components:
Large-scale commercial logging is the only cause or driver of forest degradation in PNG.
Any area of forest which has been degraded (by loggers) will never regenerate but will be cleared by humans or degrade to non-forest as a result of fire within a few years.
No area of land from which the forest has been cleared by any force or activity will revert to forest within the foreseeable future.
Given that the authors of the RSLUP report define the process of “degradation” as the “conversion of primary or climax forest into secondary forest through commercial logging or low intensity burning” (Shearman et al., 2008: 24; our italics), they exclude the potential long-term impact of shifting cultivation. This conclusion seems to be based on the observation that local farmers typically remove all the trees from a patch of forest before planting their food crops or cash crops on the newly cleared plot, so this counts as an act of “deforestation” rather than “degradation”. They also argue that “many decades” are required for subsistence gardens to revert to forests and “the transition to a primary forest composition may take centuries” (ibid.: 40).
This is not consistent with what we know about the practice of shifting cultivation in PNG. If farmers plant food crops, they do not actively suppress forest regeneration and normally allow the forest to regenerate after one or two years. After 10, 20 or 30 y, the result will be a patch of “secondary forest”. Indeed, it will most likely resemble the patch of secondary forest which they cut down to make the original garden. If the new patch of forest is not to be counted as either “secondary forest” or “degraded forest”, why should the original patch of forest be counted as “primary forest”?
What is occurring is a cycle of clearance, cultivation and regeneration in which the key variable is the period of time for which the land is cultivated and left to fallow (Ruthenberg, 1980). This could be described as a form of “degradation” if there is a long-term decline in the quality of the secondary forest cut down at the end of each cycle, or if we choose to regard this type of secondary forest as a perpetually degraded form of the “primary forest” which might once have covered the land that is now being cultivated. But it can only be described as “deforestation” if the farmer does not allow the land to revert to forest fallow or if the fallow period is too short for the process of regrowth to produce something which qualifies as a “forest”. This may happen in some areas, especially where farmers are planting cash crops or where gardening land is in short supply. But there is no reason to assume that it has happened to every single patch of forest which farmers have cleared for cultivation since 1972.
Commercial logging practices in PNG can also bear a closer resemblance to the practice of shifting cultivation than is commonly acknowledged. The RSLUP report seems to contradict one of its own assumptions when it concedes that “canopy gaps and snig tracks are usually covered over by regrowth within 1 to 5 years” of a selective logging operation (Shearman et al., 2008: 112). Where evidence of “degradation” could no longer be seen in the satellite imagery, the authors had to infer the spatial extent of degradation from other evidence about the spatial distribution of logging activity in earlier years, including evidence contained in the FIMS dataset (ibid.: 113). Evidence of regrowth or regeneration has thus been ignored in order to maintain the assumption that any existing area of forest which has been commercially logged at any time in the past must now be “degraded” until such time as it ceases to exist altogether.
This argument seems to be based on the extent of the damage or degradation actually caused by selective logging operations, and the risk which this either poses to the process of regeneration or the opportunity which it presents for local farmers to complete the process of deforestation. The RSLUP report claims that “the total volume of trees killed by logging operations is typically 15–16 times the volume of timber exported” (Shearman et al., 2008: 24), by which the authors seem to mean that each cubic metre of log exported from PNG entails the death or consumption of at least 15 additional cubic metres of timber (ibid.: 56). This estimate is apparently based on previous studies which found that 40–70% of the trees in a logged-over forest are killed or fatally damaged by such operations (Cameron and Vigus, 1993). This general level is supported by other studies (Kobayashi, 1994).
It is not our intention here to argue that the level of collateral damage associated with harvesting in PNG is low or has been at an acceptable level. Reduced impact logging practices could greatly improve the outcome of timber harvesting operations. However, the reality is that the intensity of harvesting in native forests in PNG has varied considerably, depending on the density of commercial species and the particular species of interest to the harvesting company. In addition, we question the assumption that timber harvesting must inevitably lead to the complete loss of these “degraded” forests, whether by local farmers clearing new land for cultivation or because of fires which consume the remaining vegetation. The authors of the report themselves say that “23% of forest lands that had been logged were subsequently converted to non-forest cover, and therefore could no longer be classified as ‘regenerating secondary forest’ (Shearman et al., 2008: 52)”. This implies that the other 77% should be classified as such.
The FIMS dataset tells a different story about the loss of “primary rainforests” (Tab. IV). If we now assume that the FIMS and RSLUP assessments share a common starting date in 1972 (the year in which most of the Skaipiksa photographs were taken), we can compare their respective estimates of annual rates of change over a 24-y period (1972–96) and a 30-y period (1972–2002):
FIMS estimates of contribution of logging to deforestation in PNG, 1975–1996.
-
According to the FIMS dataset, the area logged and left to regenerate was 801 km2 per annum, while the RSLUP report tells us that the area “degraded” by logging operations was 973 km2 per annum.
-
According to the FIMS dataset, the area deforested by a combination of logging and subsequent clearance was 145 km2 per annum, but the RSLUP report claims 296 km2 per annum – more than double the FIMS estimate.
-
According to the FIMS dataset, the area deforested or cleared without having first been logged was 392 km2 per annum, but the RSLUP report claims 1247 km2 per annum – more than triple the FIMS estimate.
It would be interesting to know what proportion of this area still showed visible evidence of reduced forest cover in the satellite imagery from 2002, but the approach taken by the authors of the RSLUP report seems to have prevented them from attempting an answer to this question.
3. BETTER ESTIMATES OF FOREST CONVERSION AND MODIFICATION IN PNG
We now consider more realistic estimates of the areas which have been “degraded” (modified) or “deforested” (Tab. III). We generally agree with the estimates in the RSLUP report of forest loss associated with mining and export crop plantations (primarily oil palm, although mining losses are probably underestimated and plantation conversion overestimated). However, we contend that the RSLUP report has overestimated the combined effect of fire and selective harvesting on the extent of PNG’s “primary forest area” and grossly overestimated the specific effect of local farming systems.
3.1. Major forest fires
The basis for the claim that forest fires accounted for 4.4% of the process of DFD in the period 1972–2002 (Shearman et al., 2008: 70) is unclear. The authors argue that forest fires are the second most important driver of deforestation following subsistence farming in the lower and upper montane zones (above 1000 m altitude), that local farmers are mainly responsible for lighting them (accidentally or deliberately), and that the damage reaches a peak during times of drought (ibid.: 26, 70). Since no cultivation takes place in the “upper montane zone” (above 2800 m), fire would presumably be the sole factor responsible for the apparent disappearance of 1010 km2 of alpine forest cover in this zone (ibid.: 11, 26). On the other hand, most of the areas shown to be affected by major fires in 2006 (outside the study period) are lowland areas (below 1000 m), or areas not previously covered by forest, or parts of Western Province that were neither covered by forest nor included in the RSLUP land cover classification for 2002 (ibid.: 71, 120).
We should not be surprised to find evidence of fire damage in satellite imagery from around 2002, less than five years after the El Ni no-related drought of 1997–1998. These fires almost certainly exceeded the scale of any drought-related fires that had occurred in PNG since 1942. Despite the regular occurrence of El Ni no-Southern Oscillation (ENSO) events in PNG’s climatic history, only two events of equivalent severity (in 1914 and 1941) have been recorded since the advent of colonial administration in the late nineteenth century. Widespread “bush fires” were observed on both occasions (Chinnery, 1929: 45; Pacific Islands Monthly, November 1941), but there is no evidence that they resulted in a permanent transformation of the landscape, and much of the area which burned would have been included in the FIMS “gross forest area” in 1972. Widespread forest fires were not observed in 1965 or 1972 – the two strongest ENSO events between 1941 and 1997. In 1997, fires observed from the air in montane forests appear to have been burning on the ground and no crown fires were seen. Only in high altitude valleys (above 2500 m) was there evidence of trees being killed by fire spreading up from grasslands in the valley bottoms. It is at these high altitudes that fire may result in permanent conversion of forests to grasslands (Corlett, 1987).
Fire has been shaping PNG’s vegetation patterns through thousands of years of human settlement and cannot simply be understood as occasional acts by local farmers that result in long-term forest loss (Johns, 1989, 1990; Haberle et al., 2001). There is clear evidence that forests can recover from such events and the structure of forests prior to major fires has been, in some parts, determined by previous such events. We also dispute the contention that selective logging increases the risk of major forest fires associated with the occupation of logged-over forest by landless migrants, as this is almost unknown in PNG.
3.2. Selective logging operations
There has been little analysis of the timber volumes per hectare recovered from large-scale timber harvesting operations in PNG. We know that this varies widely with the density of merchantable species and the market requirements of the forest operator. The RSLUP report suggests an average rate of extraction of 13 cubic metres per hectare over the period 1993–2005 (Shearman et al., 2008: 56), which is consistent with other studies (Keenan et al., 2005). Using this figure with the reported annual log export volume produces an estimate of 2166 km2 of forest modification as a result of logging in 2007, when log exports were just over 2.8 million cubic metres (Fig. 1), and a total of around 30000 km2 impacted by logging over the period 1972–2002 – similar to the area of 28380 km2 if data from the FIMS dataset is extrapolated over the same time period – but considerably less than the 38000 km2 stated elsewhere in the RSLUP report (see Tab. III). This difference is not explained.
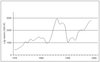 |
Figure 1 Raw log exports from PNG, 1978–2007. |
Dividing this estimate of the annual rate of forest modification due to timber harvesting (2166 km2 in 2007) into the 86838 km2 of “primary commercially accessible forest area” considered to be remaining in 2002 (Shearman et al., 2008: 101), it would take another 40 y for the accessible forest area to be completely logged over, and 83% of it would be “gone” by 2035. This is inconsistent with the contentions in the RSLUP report and related media releases.
A further matter of debate is the current condition and future growth trajectory of the area – perhaps 30000 km2 – which has been logged and left to regenerate. If we leave aside the risk of accidental conflagration, in our understanding of the dynamics of PNG forests there are three possibilities: it will be cleared by local farmers and planted to cash or food crops; it will be subject to another round of commercial logging if there are sufficient commercial stems available; or it will be left to regenerate and recover through successional processes.
Planning for sustainable harvest in natural forests in PNG is highly complex (Keenan et al., 2005). The extent of forests that have been harvested in the past that might sustain a harvest at some point in the near future, within 20–40 y, is not clear. As indicated above, the intensity of the original harvest and the residual stand condition is highly variable. Some forests are already being subjected to further cutting, either by timber processing companies or by small-scale sawmillers, and this may be causing a longer term reduction in forest timber volume, biomass or carbon stock. However, many forests are regenerating at varying rates (Yosi et al., in review).
3.3. Local farming systems
When members of the CSIRO team updated the PNGRIS dataset in 1996, they found that there had been a 15.6% increase in the total area of “significant land use” over the period since 1975, but a 9.5% decline in the total area of “very low” land use intensity, and a much smaller decline in the much larger area where there were no detectable signs of human land use at all (Tab. V). Areas of “significant” land use intensity are defined here as those in which the proportion of man-made vegetation was at least 20% of the total (with a modal value of 50%), and areas of “very low” land use intensity are defined as those in which it was less than 20% of the total (with a modal value of 10%). The PNGRIS dataset distinguishes seven classes or levels of land use intensity on cultivated land, but we have simplified our presentation of the data by calling the five highest levels “significant” and the two lowest levels “very low”.
Changes in patterns of land use intensity in PNG, 1975–1996.
Thus, the total area of PNG’s undisturbed “natural” landscapes – including most of its “primary forest area” – had declined by just over 1% over 20 y, and still accounted for almost three quarters of the country’s total surface area. But since forested land with “very low” levels of land use intensity was assigned to the “gross forest area” in the FIMS dataset, the reduction in the total area of so-called “primary forest” was somewhat higher. Up to 20% of the forest in these areas of very low land use intensity could be counted as “secondary forest” because there was evidence of the land having once been cultivated. This was counted as part of the “gross forest area” in the FIMS dataset because the purpose of this dataset was not to establish an ecological distinction between “primary” and “secondary” forest, but to determine the potential timber harvest from any type of forest.
Two thirds of the increase in the area of significant land use detected in the PNGRIS update was attributed to the expansion of small-scale indigenous farming systems, while most of the rest was attributed to the growth of towns and large-scale agricultural estates. Since the rural population grew by 50% over the same period, this indicated that rural villagers were raising the productivity of land already under cultivation without clearing new areas of primary forest, but also that they were raising the intensity of land use in certain types of physical environment by reducing the extent or duration of secondary forest regrowth in such areas.
The Mapping Agricultural Systems Project (MASP) dataset contributes further understanding of the dynamics of forest fallows. This was established using field surveys (1991–96) in areas that the PNGRIS dataset had described as “agricultural land use” (Saunders, 1993a) – including areas of very low land use intensity that the FIMS dataset assigned to PNG’s “gross forest area”. These areas were divided into 287 local agricultural systems distinguished from each other by one or more of four variables – cultivation period, crop types, fallow period, and type of fallow vegetation (Bourke et al., 1998). This project defined “land use intensity” as the ratio of the cultivation period to the fallow period in each of these agricultural systems.
An area of 109300 km2 of land was identified as being used by local farmers (23.5% of PNG’s total land area, not including land occupied by large-scale plantations or estates). Fifty percent was found to be left in fallow for periods of more than 15 y, while another 43% was fallowed for periods of 5–15 y, and only 7% was fallowed for less than 5 y (Allen et al., 2001). Tall secondary forest was the typical fallow vegetation cleared for cultivation on 56% of the land used by local farmers. This included 52151 km2 of very low land use intensity included in the FIMS “gross forest area” (Tab. II). The authors of the MASP dataset could only find 12 locations (or agricultural systems) where previously unused primary forest was being cleared for cultivation.
The conclusion in the RSLUP report regarding “expansion of subsistence agriculture” at the expense of primary rainforest (Shearman et al., 2008: 40–49) may actually refer to loss of tall secondary forest but, even so, the rate of forest loss still appears to be grossly exaggerated. The MASP dataset identified just 1.6% (1100 km2) of the 65770 km2 of tall secondary forest as being at risk of degradation (to the status of low secondary forest) or deforestation (by conversion to scrub, cane grasses or short grasses) over a 25-y period. Most agriculture in regions with population densities exceeding 100 persons per square kilometre already had non-forest forms of fallow when they were surveyed in the early 1990s. So far as local farmers are concerned, DFD is not a problem in itself so long as agricultural techniques are adapted to the maintenance of soil fertility, but rapid conversion of forest fallows to other forms of fallow through successive cultivation cycles is unlikely to be a widespread occurrence because current patterns of land use intensity already reflect soil fertility in most parts of the country.
If the authors of the RSLUP report had adopted the same classification of the landscape as that which informed the earlier PNGRIS, FIMS and MASP datasets, they might have made some useful additions to our knowledge of recent rates of DFD in both primary and secondary forest areas. The report is associated with an update of the PNGRIS dataset (Bryan and Shearman, 2008) which contains no information on land use intensity and therefore fails to tell us anything more about recent rates of DFD. In our view, this was a lost opportunity.
Further, it is misleading to describe the activities involved in this process of intensification as mere “subsistence”. The RSLUP report treats this as a sort of residual category covering any form of deforestation which could not be attributed to one of the other four drivers (Shearman et al., 2008: 113). Local farmers grow substantial quantities of export crops such as coffee and cocoa, and they sell substantial quantities of other crops in local or national markets. Residents of rural and peri-urban areas harvest large quantities of timber as fuelwood or construction materials. Some of them utilise timber through the operation of portable sawmills. But most of these activities are concentrated in areas that were excluded from the area defined as “primary forest” in the FIMS dataset, and which should have been excluded from the area to which the RSLUP report has chosen to apply the same label. It is thereforeessential to distinguish between their contribution to the removal or modification of “primary” and “secondary” forests.
It is very hard work for local farmers to convert primary forests, or even some types of grassland, to areas suitable for cultivation, even when they have steel axes. They might do better with chainsaws, but very few farmers have so far adopted this technology for purposes of land clearance. That is why they prefer, where possible, to maintain a system of rotation in which forest fallows or areas of “secondary forest” are cleared for cultivation at intervals of at least 10 y. In the early 1990s, half of the area used by local farmers was being fallowed for more than 15 y, while the other half was being fallowed for shorter periods by a larger proportion of the total farming population (Allen et al., 2001).
In some areas, the rotation has proved to be unsustainable because the fallow period has been too short, and successive acts of clearance over the course of a century or more have resulted in conversion of secondary forests to grassland or scrub. This has rarely been a sudden and dramatic transformation of the landscape, but one that has taken place after several cycles of cultivation and regeneration (Robbins, 1960; Bowers, 1968).
Collection of firewood is a potential further contributor to long-term biomass reduction following timber harvesting. Annual firewood use in PNG is estimated at 6.4 million cubic metres, more than three times the volume of the country’s raw log exports (Ambia, 2005). A study in Enga Province some years ago found that per capita consumption was 2.25 m3 per annum in rural areas and 1.9 m3 per annum in urban areas (Carrad, 1982). Since Enga is PNG’s coldest province, the national average should have been lower than this, and there is no reason to think it would have risen over the past 30 y, even with the recent spike in oil prices. Local villagers may remove some firewood from trees which die as a result of selective logging operations but, in most rural areas, villagers can get most of the firewood they need in the process of clearing secondary forest or fallow vegetation for new gardens.
Thus, our contention is that most of the intensification of traditional farming systems that has occurred in PNG since 1972 will be in those areas that have been subject to extensive modification in the past and not through conversion of primary forest or the widespread invasion of areas that have been subject to timber harvesting.
4. DISCUSSION AND POLICY IMPLICATIONS
Based on our analysis we arrive at the following conclusions:
The rate of deforestation (particularly of primary forest) is much lower than the rate postulated in the RSLUP report. In our view, the rates of forest conversion indicated in the FIMS study remain the best estimates of deforestation and there is little evidence to suggest that processes of conversion have changed in the 13 y since that study was completed.
Much of what the RSLUP report considers as deforestation is part of a cycle of traditional clearance for farming, fallow and regrowth that has been occurring for hundreds of years, or else it is selective logging with a proportion of the forest recovering.
Consequently, the rate of forest modification (which may or may not result in long-term degradation) is higher than the rate postulated in the RSLUP report. It is primarily driven by selective logging operations, but it is much harder to measure by means of aerial photographs or satellite imagery. The degree to which timber harvesting will result in long-term reduction in forest biomass and carbon stock is highly uncertain.
4.1. Primary and secondary forests
Our conclusions are not significantly affected by the divergence of prevailing national definitions of primary or secondary “forest” from those used by the FAO, but this divergence does raise some additional questions. The PNG government has previously chosen to define a “forest” as an area of trees with “touching or overlapping crowns” (Hammermaster and Saunders, 1995: 7). This means that much of the land that was defined as either (natural) “woodland” or “areas dominated by land use” in the FIMS dataset, and thus excluded from the “gross forest area”, would certainly meet the international definition of a forest as “land spanning more than 0.5 ha with trees higher than 5 m and a canopy cover of more than 10 percent, or trees able to reach these thresholds in situ” (Schoene et al., 2007: 5). The FIMS dataset therefore treats the transformation of (primary) forest (with touching or overlapping crowns) into “areas dominated by land use” as a form of deforestation, even though substantial parts of the land used by shifting cultivators would count as (secondary) forest at any given moment in time. The FIMS dataset indicated that the rate of this type of conversion from 1975 to 1996 was actually very low, but it does not tell us the rate at which “woodland” was being converted to some form of land use, nor the rate at which “secondary forests” were reduced below the threshold for the international definition of a “forest”. Likewise, the FIMS dataset tells us what proportion of the gross (primary) forest area had been selectively logged and left to regenerate, and it could be argued that this activity is consistent with some definitions of “degradation”, but there is no data on the extent of such “degradation” in woodlands disturbed by human activity or the forest fallows associated with shifting cultivation.
The RSLUP report has failed to either update or complement the information presented in the FIMS dataset because of the false assumptions behind its calculations.
4.2. National carbon calculations
Past debates about the “sustainability” of large-scale logging operations and indigenous farming systems in PNG have mainly been concerned with yields of timber and food respectively. In each case, attempts have been made to calculate the length of the “cutting cycle” required to maintain the volume of timber or food which can be extracted from one hectare of land in different physical environments but with fairly constant (and fairly crude) technical inputs. The question now posed by the PNG government and other members of the Coalition for Rainforest Nations is how to measure an ecosystem service – carbon storage or sequestration – and then seek compensation from the international community for the cost of maintaining this service.
Overestimates of the spatial extent and temporal rate of DFD in the RSLUP report inflate the potential for compensation for PNG for measures to reduce greenhouse gas emissions from these activities. The RSLUP report reckons that DFD in PNG released between 146 and 269 million tonnes of carbon dioxide (MtCO2) into the atmosphere in 2007, 32% of which was the result of large-scale logging operations (Shearman et al., 2008: 19). If conservation of the carbon content of the logging industry’s share of emissions were valued at US$10 per tonne, the authors reckon the reward for not releasing it would exceed the current export value of PNG’s log harvest.
The basis of these estimates is unclear, but we note that the lower end of their range for 2007 (146 MtCO2) is very similar to the estimate previously made by Houghton (2003) for PNG’s total emissions from “land use change and forestry” in the year 2000. Houghton’s figure was obviously not based on the findings of the RSLUP report, but was derived from a global assessment of emissions from all “rainforest nations” on the rather crude assumption that all had similar rates of DFD. Houghton’s number was incorporated into the “Climate Analysis Indicators Tool” developed by the World Resources Institute (Baumert et al., 2005), and has since been used as grounds for suggesting that PNG’s per capita emissions of carbon dioxide may be as high as those of Australia (Garnaut, 2008: 238).
There have been few published studies of forest biomass in PNG. Recent analysis indicates that carbon stocks in PNG forests are generally lower than in forests elsewhere (Fox et al., in review), with estimates of carbon in above-ground live biomass of 84 and 125 tonnes per hectare in cut-over and primary forests respectively. When we combine this with the relatively low rates of deforestation in PNG reported in the alternative sources of information discussed previously, the resulting carbon dioxide emissions are likely to be considerably lower than those suggested by Houghton et al., (2000) or the RSLUP report. The calculations contained in the RSLUP report have also drawn fire from the logging industry because they ignore the capacity of regenerating forest to absorb the carbon dioxide released by the DFD process (PNGFIA, 2008). This analysis is further complicated by the fact that carbon dioxide emissions from exported wood may not necessarily form part of PNG’s greenhouse accounts.
Areas of primary forest that are cleared and replaced by timber plantations, or tree crops like oil palm, recover some level of carbon as planted trees grow to maturity (Houghton et al., 2000) although the average carbon stock over time in these systems is generally much lower than in primary forest(Swallow et al., 2007). Similarly, lands that have been impacted by traditional land use practices may be in a carbon-neutral condition if the number of years over which the regenerating forest grows is sufficient to reabsorb the carbon dioxide released through its clearance. These systems have particular “time-averaged” carbon stocks that depend on regeneration growth rates and “rotation time” (IPCC, 2000; Palm et al., 2005; Swallow et al., 2007). In a country like PNG, such estimates are further complicated by the diversity of local physical environments (especially soils and climate) and local land use practices (especially shifting cultivation systems).
The calculation is more difficult in the case of forests subject to periodic selective logging because of variation in the proportion of the biomass in a logged-over forest which remains intact or is dead and left to decay. Commercial timber harvests and log export volumes have also fluctuated a great deal over the last 30 y due to market factors, further complicating the process of forming an appropriate baseline.
Accounting for land-based emissions or removals of greenhouse gases is undertaken on a given area (a defined project area or political unit) over a given time (usually one or five years). Policy processes then set targets to reduce this net level of emissions in a future time period compared to the baseline. Although policy measures might target specific activities like afforestation or avoided deforestation, at the national level the emissions target is generally set across all sectors. The rates of forest conversion, modification and traditional use reported in the PNGRIS, FIMS and MASP datasets provide a starting point for such calculations.
Extrapolation from survey data collected by the Alternatives to Slash and Burn Project in other tropical regions (Swallow et al., 2007) would indicate that tall secondary forest fallows in PNG store about 16.5 million tonnes of carbon, and conversion of this forest to lesser forms of vegetation would reduce this stock of carbon by between 130000 and 240000 tonnes over 25 y, depending on whether tall secondary forest is “degraded” to lesser forms of forest or converted to scrub and grassland. In forming their view on an appropriate baseline for assessing deforestation or “forest degradation”, the authors of the RSLUP report have chosen to ignore this evidence and assume that forests in PNG that have been impacted by these processes are on an irreversible path of forest loss.
4.3. Moral hazard and policy options
There is no evidence to indicate that the authors of the RSLUP report have consciously inflated their claims about the rate of DFD in order to bolster the PNG government’s own claims for compensation from the international community for any action taken to mitigate this process. So far as they are concerned, “the current state of forest management and lack of effective governance means that PNG is a long way from being able to meaningfully participate in the carbon economy” (Shearman et al., 2008: 7). If they believe in the objective validity of their own findings, they might instead hold the government responsible for the double standard entailed in the moral hazard described in the introduction to this paper, because the government’s current proposals to participate in the carbon economy have gone hand in hand with efforts to “fast-track” the development of new logging concessions.
Shearman et al.’s case for stronger regulation of the logging industry to achieve emission reduction objectives might have been more forceful if their false assumptions had not led them to exaggerate the contribution of indigenous farming systems to the DFD process. In other jurisdictions, this might give the government an opportunity to claim carbon credits for action taken to change local farming practices or remove more of the nation’s forests from the control of local communities. But in a country where nearly all of the land and forests still belongs to customary landowners who are dependent for their livelihoods on indigenous farming systems, there are stronger legal safeguards to prevent this occurring.
It is widely agreed that the PNG government has little or no capacity to change local farming practices. The best (or worst) it can do is to persuade local people to surrender specific rights to the use of their forests (such as for timber) in return for the promise of future rewards which have often not been delivered or have failed to meet the expectations of the recipients. While there are some promising recent developments with small-scale international markets for certified timber produced by community-based operations, the government generally maintains an apparent monopoly on the right to decide who can harvest logs from these forests and participate in a commercial export market, and it then retains most of the tax revenues. Consequently, the prospect of global trade in sequestered forest carbon could add a new dimension to this form of unequal exchange unless the government allows landowners to trade directly in this new commodity. Meanwhile, the logging industry has staked its own claim to share in any carbon credits which arise from action taken to reduce the level of emissions from selective logging operations authorised by the government (PNGFIA, 2008). The distribution of rights and rewards from reduced deforestation and degradation sits at the core of PNG’s carbon policy debate and its global counterpart (CRN, 2008). This debate needs to be informed by valid and properly constructed estimates of these processes that take into account the land use history, current land management, and forest regeneration capacity of countries like Papua New Guinea.
Acknowledgments
The authors would like to thank Robin Hide and Luca Tacconi for their comments on earlier drafts of this paper.
References
- Allen B.J., Bourke R.M. and Hanson L., 2001. Dimensions of PNG village agriculture. In: Bourke, R.M., Allen, M.G. and Salisbury, J.G. (Eds), Food security for Papua New Guinea: Proceedings of the Papua New Guinea food and nutrition 2000 conference. Australian Centre for International Agricultural Research (Proceedings 99), Canberra, pp. 529--553. [Google Scholar]
- Ambia V., 2005. Global forest resources assessment 2005: Papua New Guinea country report. , Papua New Guinea country report. PNG Forest Authority, Port Moresby. [Google Scholar]
- Baumert K.A., Herzog T. and Pershing J., 2005. Navigating the numbers: Greenhouse gas data and international climate policy, World Resources Institute, Washington DC. [Google Scholar]
- Bellamy J.A. and McAlpine J.R., 1995. Papua New Guinea inventory of natural resources population distribution and land use handbook, 2nd ed., Australian Agency for International Development (PNGRIS Publication 6), Canberra. [Google Scholar]
- Bourke R.M., Allen B.J., Hobsbawm P. and Conway J., 1998. Agricultural systems of Papua New Guinea: Working paper 1. Australian National University, Canberra, and PNG Department of Agriculture and Livestock and University of Papua New Guinea, Port Moresby. [Google Scholar]
- Bowers N., 1968. The ascending grasslands: An anthropological study of ecological succession in a high mountain valley of New Guinea. Ph.D. thesis, Columbia University. [Google Scholar]
- Brown S., Hall M., Andrasko K., Ruiz F., Marzoli W., Guerrero G., Masera O., Dushku A., DeJong B. and Cornell J., 2007. Baselines for land-use change in the tropics: Application to avoided deforestation projects. Mitigation and Adaptation Strategies for Global Change 12: 1001–1026 [CrossRef] [Google Scholar]
- Bryan J.E. and Shearman P.L., 2008. Papua New Guinea resource information system handbook, 3rd ed., University of Papua New Guinea (PNGRIS Publication 7), Port Moresby. [Google Scholar]
- Cameron A.L. and Vigus T., 1993. Papua New Guinea volume and growth study: Regeneration and growth of the tropical moist forest in Papua New Guinea and the implications for future harvests. Commonwealth Scientific and Industrial Research Organisation, Division of Wildlife and Ecology, Brisbane. [Google Scholar]
- Carrad B., 1982. The economy. In: Carrad B., Lea, D.A.M. and Talyaga, K. (Eds), Enga: Foundations for development. University of New England, Armidale, pp. 146--180. [Google Scholar]
- Chinnery E.W.P., 1929. Studies of the native population of the east coast of New Ireland. Territory of New Guinea (Anthropological Report 6), Canberra. [Google Scholar]
- Chomitz K.M., 2007. Agricultural expansion, poverty reduction and environment in the tropical forests, World Bank, Washington DC., [Google Scholar]
- Colchester M., Boscolo M., Contreras-Hermillosa A., Gatto F.D., Dempsey J., Lescuyer G., Obidzinski K., Pommier D., Richards M., Sembiring S.S., Tacconi L., Rios M.T.S. and Wells A., 2006. Justice in the forest: Rural livelihoods and forest law enforcement. Forest Perspectives 3, Center for International Forestry Research, Bogor. [Google Scholar]
- Corlett R.T., 1987. Post-fire succession on Mt. Wilhelm, Papua New Guinea. Biotropica 19: 157–160 [CrossRef] [Google Scholar]
- CRN (Coalition for Rainforest Nations), 2008. Views on outstanding methodological issues related to policy approaches and positive incentives to reduce emissions from deforestation and forest degradation in developing countries. Submission to the UNFCCC Subsidiary Body for Scientific and Technological Advice, Bonn, 4–13 June 2008. [Google Scholar]
- FAO (Food and Agriculture Organisation of the United Nations), 2003. Proceedings of the second expert meeting on harmonizing forest-related definitions for use by various stakeholders, September 11–13, 2002, FAO, Rome. [Google Scholar]
- Fearnside P.M. and Laurance W.F., 2004. Tropical deforestation and greenhouse-gas emissions. Ecol. Appl. 14: 982–986 [CrossRef] [Google Scholar]
- Fox J.C., Yosi C.K., Oavika F., Nimiago P., Lavong K. and Keenan R.J. (2009). Assessing forest carbon in Papua New Guinea. Biotropica (in review). [Google Scholar]
- Garnaut R., 2008. The Garnaut Climate Change Review: Final report, Cambridge University Press, Melbourne. [Google Scholar]
- Grainger A., 2008. Difficulties in tracking the long-term global trend in tropical forest area. Proc. Natl. Acad. Sci. USA 105: 818–823 [CrossRef] [Google Scholar]
- Haantjens H.A., Mabbutt J.A. and Pullen R., 1965. Anthropogenic grasslands in the Sepik plains, New Guinea. Pac. Viewpoint 6(2): 215--219. [Google Scholar]
- Haberle S.G., Hope G.S. and van der Kaars S., 2001. Biomass burning in Indonesia and Papua New Guinea: Natural and human induced fire events in the fossil record. Palaeogeogr. Palaeoecol. 171(3/4): 259–268. [CrossRef] [Google Scholar]
- Hammermaster E.T. and Saunders J.C., 1995. Forest resources and vegetation mapping of Papua New Guinea. Australian Agency for International Development (PNGRIS Publication 4), Canberra. [Google Scholar]
- Holmgren P. and Persson R., 2002. Evolution and prospects of global forest assessments. Unasylva 53(3): 3–9. [Google Scholar]
- Houghton R.A., 2003. Data note: Emissions (and sinks) of carbon from land-use change, Woods Hole Research Center, Falmouth MA. [Google Scholar]
- Houghton R.A., Skole D.L., Nobre C.A., Hackler J.L., Lawrence K.T. and Chomentowski W.H., 2000. Annual fluxes of carbon from deforestation and regrowth in the Brazilian Amazon. Nature 403: 301–304 [CrossRef] [PubMed] [Google Scholar]
- IPCC (Intergovernmental Panel on Climate Change), 2000. IPCC special report on land use, land-use change and forestry, Watson R.T., Noble I.R., Bolin B., Ravindranath N.H., Verardo D.J. and Dokken D.J. (Eds.), Cambridge University Press, Cambridge and New York. [Google Scholar]
- IPCC (Intergovernmental Panel on Climate Change), 2003. Good practice guidance for land use, land-use change and forestry, Penman J., Gytarsky M., Hiraishi T., Krug T., Kruger D., Pipatti R., Buendia L., Miwa K., Ngara T., Tanabe K. and Wagner F. (Eds.), Institute for Global Environmental Strategies (IPCC National Greenhouse Gas Inventories Programme), Kanagawa. [Google Scholar]
- IPCC (Intergovernmental Panel on Climate Change), 2007. Climate change 2007 — mitigation: Contribution of Working Group III to the Fourth Assessment Report of the IPCC Metz B., Davidson O.R., Bosch P.R., Dave R. and Meyer L.A., (Eds.), Cambridge University Press, Cambridge and New York. [Google Scholar]
- Johns R.J., 1989. The influence of drought on tropical rain forest vegetation in Papua New Guinea. Mountain Research and Development 9(3): 248–251. [CrossRef] [Google Scholar]
- Johns R.J., 1990. The illusionary concept of the climax. In: Baas, Publishers, Dordrecht, pp. 13--146. [Google Scholar]
- Johns R.J., 1992. The influence of deforestation and selective logging operations on plant diversity in Papua New Guinea. In: Whitmore T.C. and Sayer J.A. (Eds.), Tropical deforestation and species extinction. Chapman & Hall, London, pp. 143--147. [Google Scholar]
- Kanninen M., Murdiyaso D., Seymour F., Angelsen A., Wunder S. and German L., 2007. Do trees grow on money? The implications of deforestation research for policies to promote REDD. Forest Perspectives 4, Center for International Forestry Research, Bogor. [Google Scholar]
- Keenan R.J., Ambia V., Brack C., Frakes I., Gerr, A., Golman M., Holzknecht H., Lavong K., Sam N., Vanclay J.K. and Yosi C., 2005. Improved timber inventory and strategic forest planning in Papua New Guinea. Bureau of Rural Sciences, Canberra, and Forest Research Institute, Lae. [Google Scholar]
- Kobayashi S., 1994. Effects of Harvesting impacts and rehabilitation of tropical rain forest. J. Plant. Res. 107: 99–106. [CrossRef] [Google Scholar]
- Luttrell C., Schreckenberg K. and Peskett L., 2007. The implications of carbon financing for pro-poor community forestry. Forestry Briefing 14, Overseas Development Institute, Forest Policy and Environment Programme, London. [Google Scholar]
- Malhi Y. and Phillips O.L., 2005. Tropical forests and global atmospheric change, Oxford University Press, Oxford and New York. [Google Scholar]
- McAlpine J. and Quigley J., 1998. Forest resources of Papua New Guinea: Summary statistics from the forest inventory mapping (FIM) system, Coffey MPW Pty Ltd for the Australian Agency for International Development, Canberra, and the Papua New Guinea National Forest Service, Port Moresby. [Google Scholar]
- McAlpine J.R. and Freyne D.F., 2001. Land use change and intensification in Papua New Guinea 1975–1996. Asia Pac. Viewpoint 42(2/3): 209–218 [Google Scholar]
- Paijmans K., 1975. Vegetation of Papua New Guinea (map with explanatory notes). Commonwealth Scientific and Industrial Research Organisation Land Research Series 35, Melbourne [Google Scholar]
- Palm C.A., van Noordwijk M., Woomer P.L., Alegre J.C., Arévalo L., Castilla C.E., Cordiero D.G., Hairiah K., Kotto-Same J., Moukam A., Parton W.J., Ricse A., Rodrigues V. and Sitompul S.M., 2005. Carbon losses and sequestration after land use change in the humid tropics. In: Palm C.A., Vosti S.A., Sanchez P.A. and Ericksen P.J. (Eds), Slash-and-burn agriculture: The search for alternatives. Columbia University Press, New York, pp. 41--63. [Google Scholar]
- PNGFIA (PNG Forest Industries Association), 2008. Submission to the Garnaut Review on the impact of an ETS on commercial forestry and development outcomes in PNG. [Google Scholar]
- Ramankutty N., Gibbs H.K., Achard F., Defries R., Foley J.A. and Houghton R.A., 2007. Challenges to estimating carbon emissions from tropical deforestation. Glob. Change Biol. 13: 51–66 [CrossRef] [Google Scholar]
- Robbins R.G., 1960. The anthropogenic grasslands of Papua and New Guinea. In: Symposium on the impact of man on humid tropics vegetation. Administration of the Territory of Papua and New Guinea and UNESCO Science Cooperation Office for South East Asia, Goroka, pp. 313--329. [Google Scholar]
- Ruthenberg H., 1980. Farming systems in the tropics (3rd edition). Clarendon Press, Oxford. [Google Scholar]
- Saunders J.C., 1993. Agricultural land use of Papua New Guinea (map with explanatory notes). PNGRIS Publication 1, Commonwealth Scientific and Industrial Research Organisation for Australian International Development Assistance Bureau, Canberra. [Google Scholar]
- Saunders J.C., 1993. Forest resources of Papua New Guinea (map with explanatory notes). PNGRIS Publication 2, Commonwealth Scientific and Industrial Research Organisation for Australian International Development Assistance Bureau, Canberra. [Google Scholar]
- Schoene D., Killmann W., von Lüpke, H., LoychWilkie and M., 2007. Definitional issues related to reducing emissions from deforestation in developing countries. Forests and Climate Change Working Paper 5, Food and Agriculture Organization of the United Nations, Rome. [Google Scholar]
- Shearman P.L., Bryan J.E., Ash J., Hunnam P., Mackey B. and Lokes B., 2008. The state of the forests of Papua New Guinea: Mapping the extent and condition of forest cover and measuring the drivers of forest change in the period 1972–2002, University of Papua New Guinea, Port Moresby. [Google Scholar]
- Shearman P.L., Ash J., Mackey B., Bryan J.E. and Lokes B., 2009. Forest conversion and degradation in Papua New Guinea 1972–2002. Biotropica 41: 379–390 [CrossRef] [Google Scholar]
- Stern N., 2007. The economics of climate change: The Stern Review, Cambridge. [Google Scholar]
- Swallow B., van Noordwijk M., Dewi S., Murdiyaso D., White D., Gockowski J., Hyman G., Budidarsono S., Robiglio V., Meadu V., Ekadinata A., Agus F., Hairiah K., Mbile P., Sonwa D.J. and Weise S., 2007. Opportunities for avoided deforestation with sustainable benefits, ASB Partnership for the Tropical Forest Margins, Nairobi. [Google Scholar]
- UPNG (University of Papua New Guinea), 2008. As Papua New Guinea pushes for payments for forest conservation, new analysis says nation may be running out of forests to protect. UPNG Remote Sensing Centre, Port Moresby. [Google Scholar]
- Yosi C.K., Fox J.C. and Keenan R.J. (2009). Degradation or recovery? Dynamics of forests after selective harvesting in Papua New Guinea. J. Trop. Ecol. (in press). [Google Scholar]
All Tables
Different calculations of forest cover in PNG, 1972–1975. Figures are presented in square kilometres as we consider this reflects the appropriate level of accuracy for the scale at which this data was collected.
All Figures
|
Figure 1 Raw log exports from PNG, 1978–2007. |
| In the text | |