Free Access
Figure 5
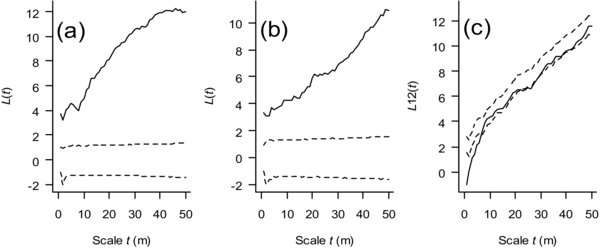
(a) Spatial distribution of female trees; (b) Spatial distribution of male trees; (c) Spatial relationships between males and females. Solid lines indicate plots of L(t) / L12(t) versus scale t; dashed indicate 95% confidence intervals.