Free Access
Figure 2
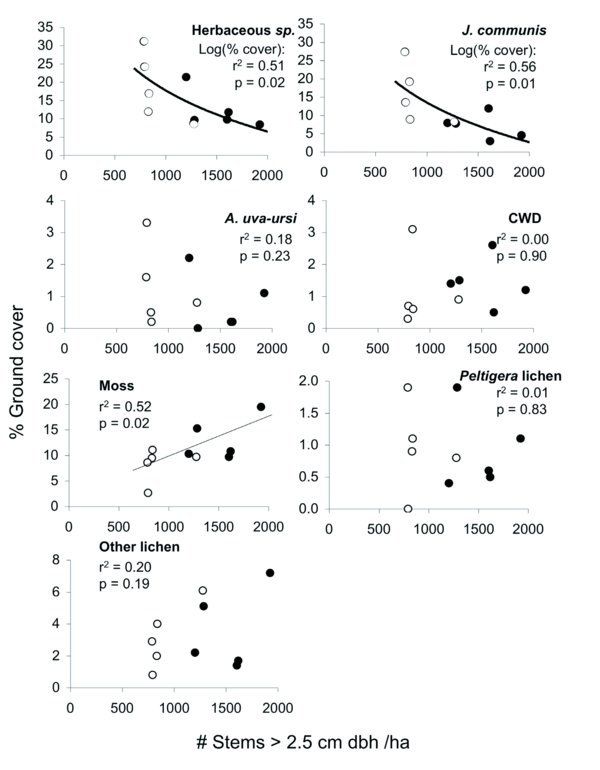
Linear relationships between density of stems (# stems > 2.5 cm dbh/ha) and percent cover of understory vegetation and litter in the 10 experimental plots at the CCGSR. Low-density and reference plots are represented as open (white) and closed (black) circles, respectively. Statistics are from linear regression analyses (stem density × % cover of patch type). CWD = coarse wood debris.