Free Access
Figure 3
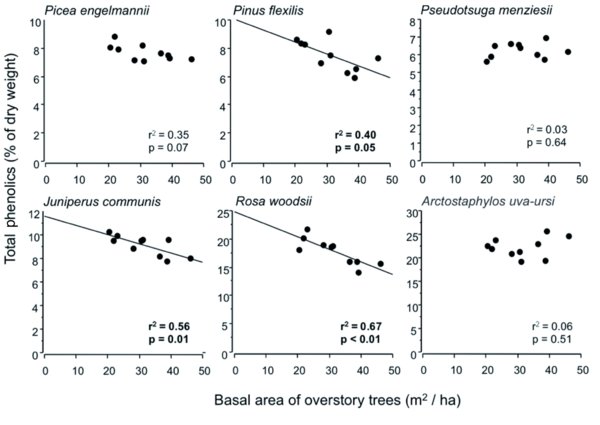
Linear relationship between stand density (basal area of overstory trees, m2/ha) and foliar phenolic content (% dry weight) of six plant species common to all plots. Statistics are from linear regression analyses (basal area × total phenolic content) by species.