Free Access
Figure 1
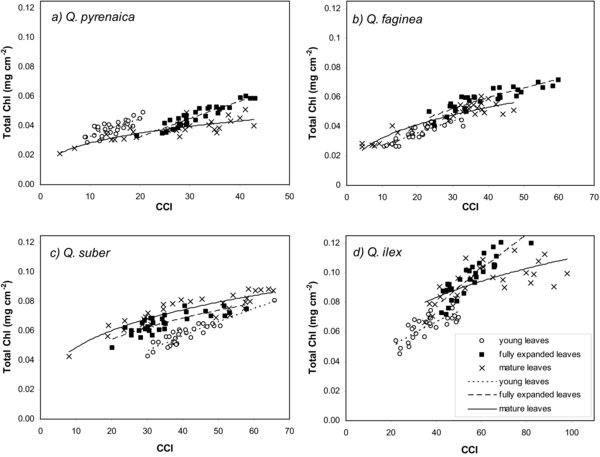
Relationship between the CCI and total chlorophyll content (total Chl, mg cm−2) in the four Quercus species. Lines are predicted values from the log-transformed functions for each leaf stage (Tab. I).
Relationship between the CCI and total chlorophyll content (total Chl, mg cm−2) in the four Quercus species. Lines are predicted values from the log-transformed functions for each leaf stage (Tab. I).