Free Access
Figure 1
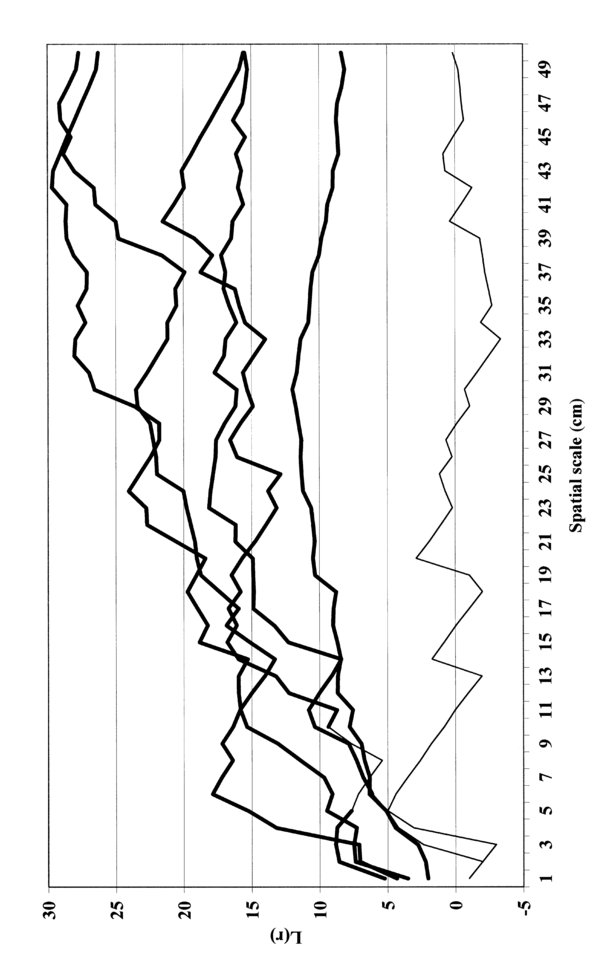
Fine-scale spatial patterns of beech seedlings analyzed using Ripley’s L function in six sectors. Each line represents the results from one sector: thick line – L(r) function exceeding the upper confidence limit; thin line – L(r) function within the confidence envelope.