Free Access
Figure 2
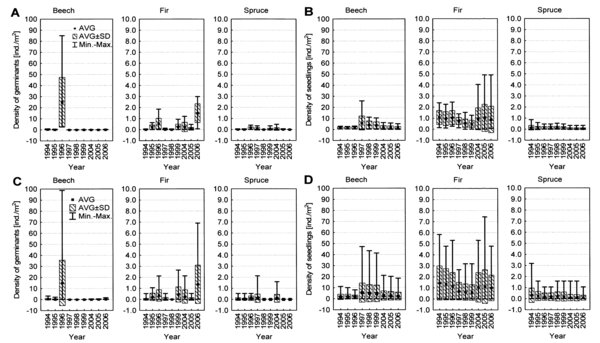
Densities of germinants and seedlings at two spatial scales: A – germinants on plots, B – seedlings on plots, C – germinants on sectors, D – seedlings on sectors. Explanations: black dot – average density, box – average density ± standard deviation, whiskers – minimal and maximal density.