Free Access
Figure S1
Download original image
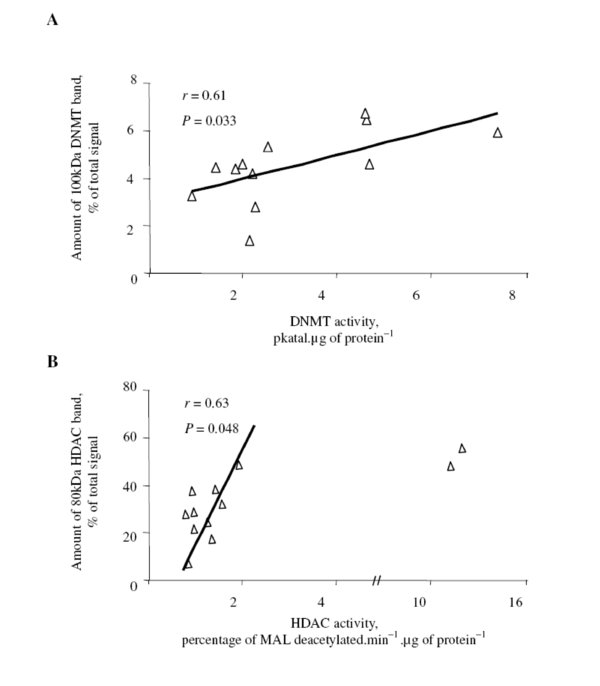
Relationship (linear correlation) measured on the apex of the six poplar genotypes in well-watered and in water deficit conditions between (A) DNMT activity and amount of DNMT band at 100 kDa (expressed in percentage of total signal, see materials and methods section for details); (B) HDAC activity and the ratio between the amount of HDAC band at 80 kDa (expressed in percentage of total signal, see materials and methods section for details). Regarding the out of range values for Carpaccio, linear correlation was computed only for the five other genotypes.