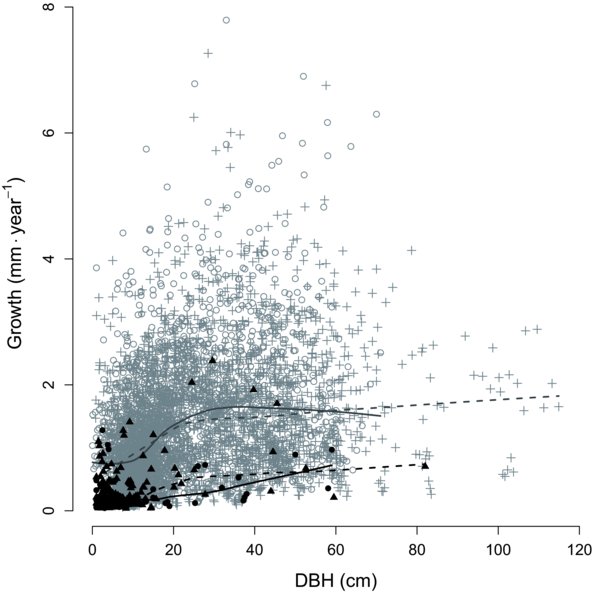
Figure 1

Data repartition for dead and living trees in regard to growth and diameter. A total of 2589 living trees (grey unfilled dots) and 53 dead trees (black filled dots) were measured for A. alba and respectively 2270 (grey cross) and 179 (black filled triangle) for P. abies. Too few dead trees were measured for large DBH (see respectively 3 and 4 dead trees for A. alba and P. abies with DBH ≥ 45 cm) to have the ability to decompose mortality given growth and diameter on this range of diameter. We used a local smoother (see function lowess() in R 2.5.0, Ihaka and Gentleman, 1996) to visualize growth-diameter relationship for dead (black curves) and living trees (grey curves) for A. alba (plain lines) and P. abies (dashed lines). The smoother indicated that past radial growth was lower for dead trees than for living trees for both species, whatever the diameter value.


