Free Access
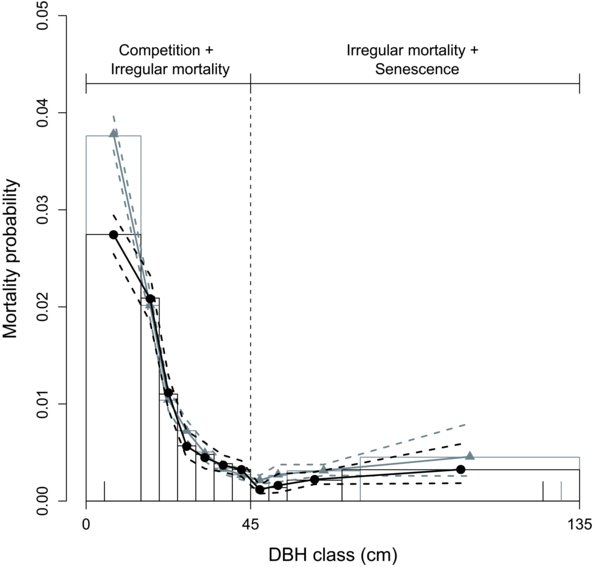
Figure 2

Mortality-diameter semi-parametric model for A. alba and P. abies. Models for A. alba (black lines and dots) and P. abies (grey lines and triangles) are represented with posterior mean (—) and 95% quantiles (- - -). Bar widths represent bins values obtained from modified Ayer’s algorithm and bar height represent maximum likelihood estimates obtained within Ayer’s algorithm. Vertical lines on the DBH axis indicate range of data for A. alba (black) and P. abies (grey).


