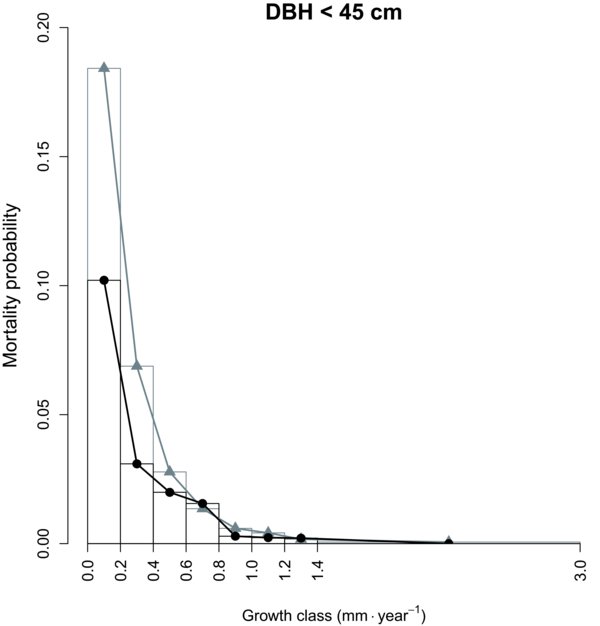
Figure 4

Mortality-growth semi-parametric model for small trees (DBH < D0) of A. alba and P. abies. Mortality estimates μGg for each growth class g of range 0.2 mm year−1 were obtained integrating the combined mortality rates μDGjk on all diameter classes j and growth class intersections k ∩ g (see Eq. (11)). Mean posterior for A. alba (black lines and dots) and P. abies (grey lines and triangles) are represented. Bar widths represent fixed bins values of 0.2 mm year−1 for growth and bar height also represent the mean posterior. 95% credible intervals due to uncertainty on priors were too narrow to be represented on the graph. From this graph, we can see that for small trees (DBH < 45 cm) at low growth (growth < 0.6 mm year−1), P. abies has a higher mortality rate than A. alba.


