Free Access
Figure 3

Download original image
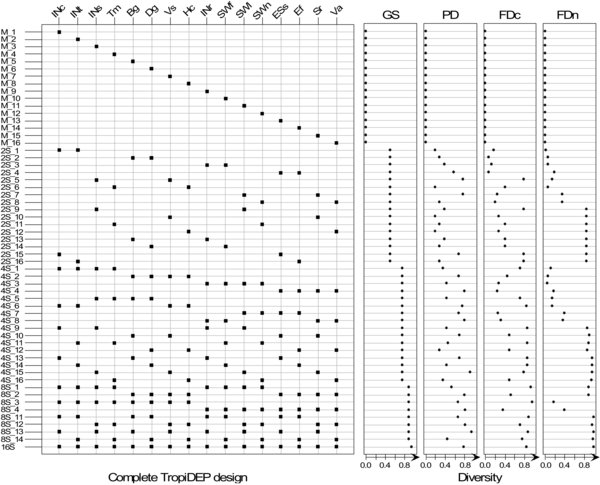
A summary of the 57 proposed plots in the complete TropiDEP design, including the 41 plots in the main design, 16 monocultures and one plot with all 16 species. Shown are the species planted in each plot (with equal relative densities), along with diversity estimates calculated as quadratic entropies with: equal distances among species (Gini-Simpson; GS), phylogenetic distances (PD), and functional distances along trait axes related to carbon (FDc) and nitrogen (FDn) cycling. Species abbreviations are given in Table II. All species are planted with the same number of repititions within richness levels and overall.


