Figure 3
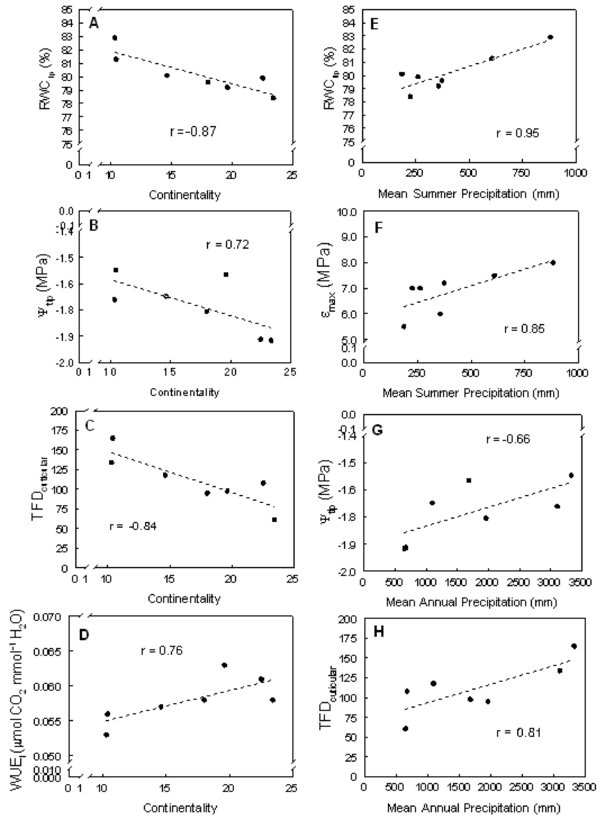
Relationship of seven western cedar populations after exposure to drought with continentality (A) relative water content at turgor loss point (RWCtlp), (B) osmotic potential at turgor loss point (Ψtlp), (C) cuticular transpiration (TFDcuticular) and (D) intrinsic water use efficiency (WUEi); mean summer precipitation with (E) relative water content at turgor loss point (RWCtlp) and (F) modulus elasticity at saturation (εmax); annual precipitation with (G) osmotic potential at turgor loss point (Ψtlp) and (H) cuticular transpiration (TFDcuticular). The r is Pearson’s correlation coefficient, and the line provides a visual assessment of qualitative trends in the data. Table I describes more details of environmental indices.