Free Access
Figure 4
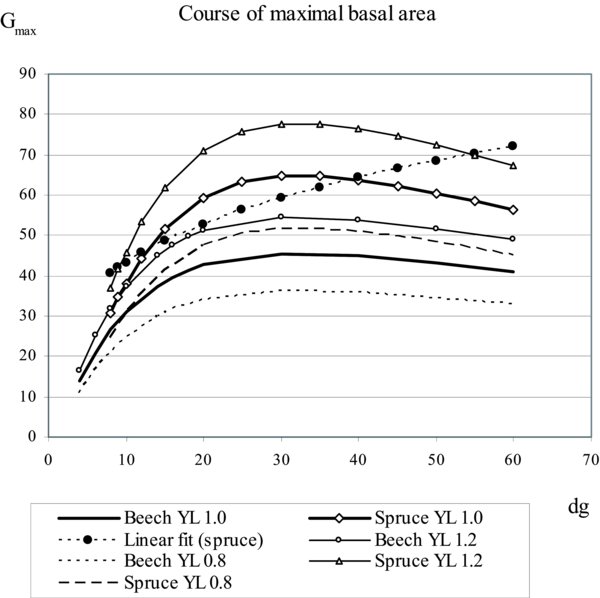
Course of the maximal basal area for spruce and beech, with variations due to the yield level of 0.8 and 1.2 respectively. For spruce, it displays the course derived from a linear ln(N) to ln(dg).
Course of the maximal basal area for spruce and beech, with variations due to the yield level of 0.8 and 1.2 respectively. For spruce, it displays the course derived from a linear ln(N) to ln(dg).