Free Access
Figure 5
Download original image
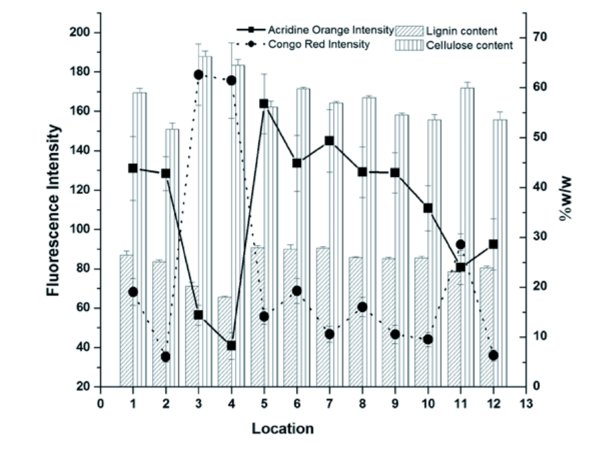
Comparative histogram showing biochemical estimation of α-cellulose and Klason lignin contents among representative accessions of B. balcooa from 12 locations (represented as 1 to 12, see Table I for details of geographical locations); gram % (w/w) values are represented on the Y-2 axis, and error bars represent ± SD values. Arbitrary units of fluorescence intensities for Congo red-labeled α-cellulose and acridine orange-labeled lignin of fiber bundles are represented on the Y-1 axis and plotted as a line with data points.