Figure 3
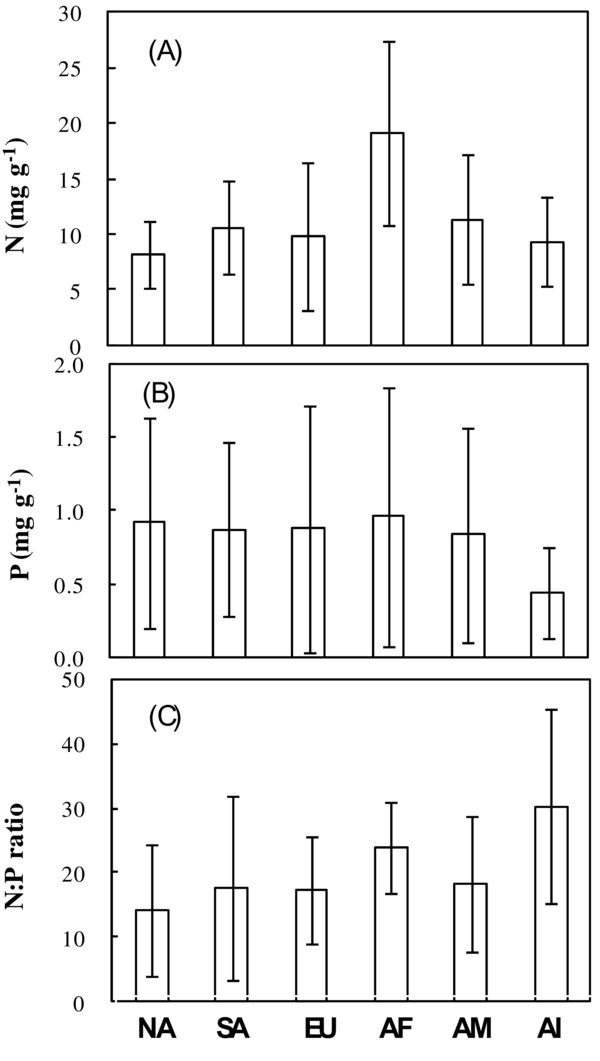
Leaf-litter N concentration (A), P concentration (B) and N:P ratio (C) for flora in North America (NA) (n = 116 for nitrogen and 97 for phosphorus and N:P ratio), South America (SA) (n = 50 for nitrogen, 19 for phosphorus and N:P ratio), Europe (EU) (n = 189 for nitrogen, 113 for phosphorus and N:P ratio), Africa (AF) (n = 21 for nitrogen, phosphorus and N:P ratio), Asian mainland (AM) (n = 127 for nitrogen, 103 for phosphorus and N:P ratio) and Asian Islands (AI) (n = 45 for nitrogen, 33 for phosphorus and N:P ratio). Vertical bars indicate standard deviation. Significant differences between the continents and islands are seen in Table II.