Free Access
Figure 4
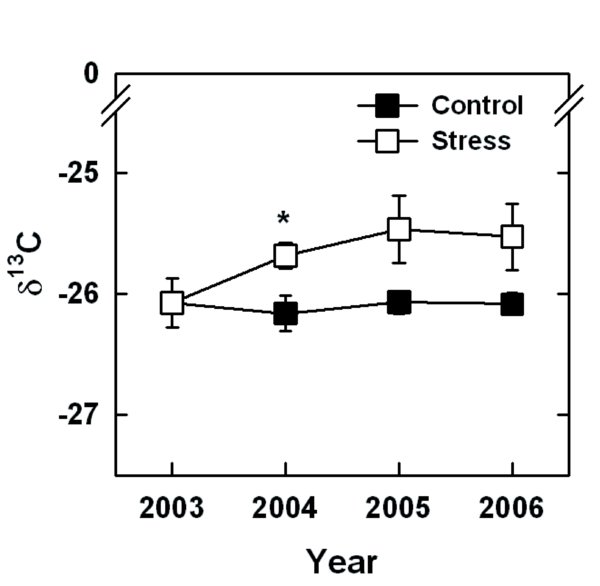
Changes in carbon isotope composition (δ13C) in tree rings from 2003 to 2006. Means and standard errors of at least four trees per treatment are shown. Asterisks indicate significant differences between stress and corresponding control values (p ≤ 0.05).