Open Access
Figure 2
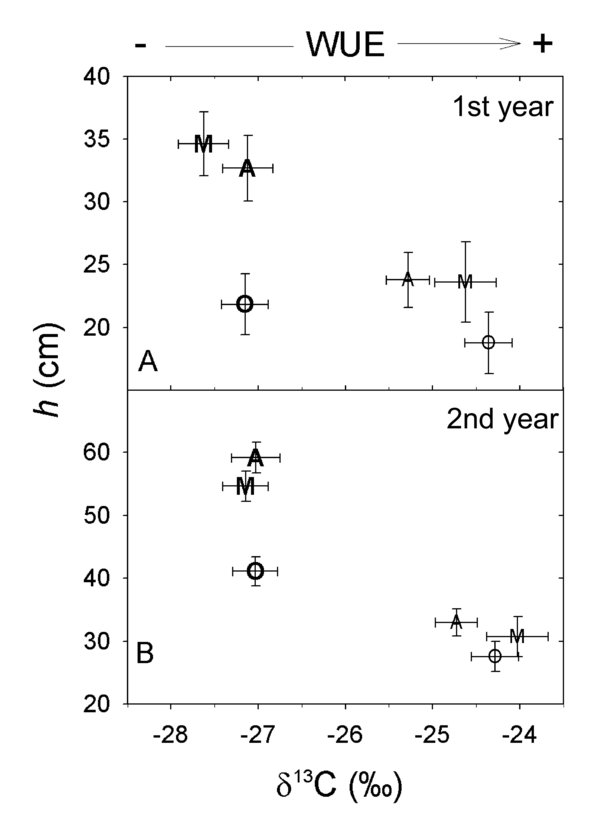
Representation of the carbon isotope composition (δ13C) vs. height (h). Population LS means the 1st (A) and 2nd years (B). Populations: Arenas (A), Oria (O) and Mimizan (M). Families per population in the xeric trial site, Xe: A (10), O (8) and M (6), and 10 families in the mesic trial site, Me (bold letters). Data are means ± standard errors. Higher values (less negative) are associated to higher water use efficiency.