Open Access
Figure 3
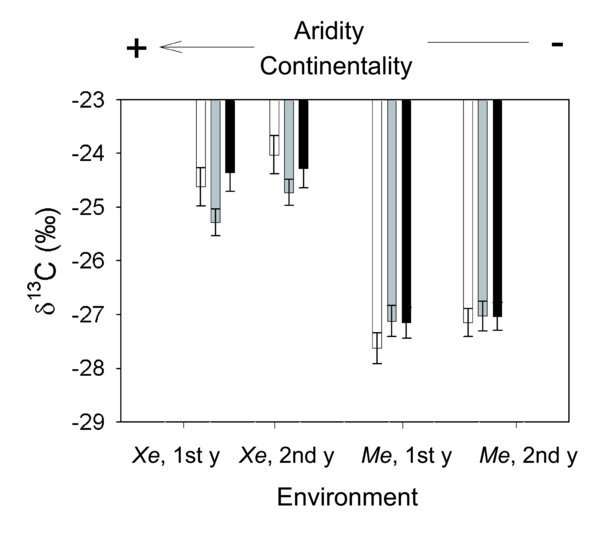
Representation of the δ13C population means and standard errors across environments (Me: mesic trial site, Xe: xeric trial site, 1st y: first year, 2nd y: second year). M: white bars, A: grey bars, O: black bars. Division of X axis obtained from a PCA integrating precipitation and temperature values. Climate close to the origin of the X axis is drier, with more extreme maximum and minimum temperatures and becomes milder and wetter along the axis. Precipitation and mean of maximum and minimum temperature values of the hottest and coldest month, respectively: Xe, 1st year: 323 mm, 32.03 °C, –1.11 °C; Xe, 2nd year: 488 mm, 30.9 °C, 0.41 °C; Me, 1st year: 704 mm, 28.5 °C, 1.04 °C; Me, 2nd year: 969 mm, 26.7 °C, 2.1 °C.