Free Access
Figure 4
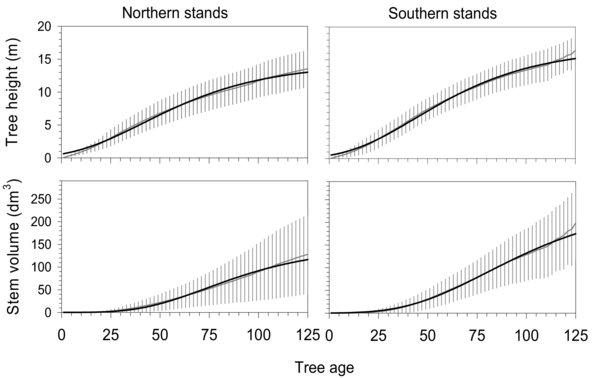
Individual growth in height and stem volume (grey line) and fitted sigmoid functions (black line) for black spruce trees from 12 stands within and north of the commercial forest in Quebec, Canada. Vertical bars correspond to the standard deviation between trees.