| Issue |
Ann. For. Sci.
Volume 67, Number 2, March-April 2010
|
|
|---|---|---|
| Article Number | 210 | |
| Number of page(s) | 7 | |
| DOI | https://doi.org/10.1051/forest/2009103 | |
| Published online | 01 February 2010 | |
Original article
Non-destructive monitoring of early stages of white rot by Trametes versicolor in Fraxinus excelsior
Contrôle non destructif des premiers stades de la pourriture blanche de Trametes versicolor chez Fraxinus excelsior
University of Applied Sciences and Art, Büsgenweg 1a, 37073
Göttingen, Germany
* Corresponding author:
This email address is being protected from spambots. You need JavaScript enabled to view it.
Received:
16
April
2009
Accepted:
16
June
2009
Abstract
• Non-destructive detection of fungal decay in living trees is relevant for forest management of valuable species, hazard tree assessment, and research in forest pathology. A variety of tomographic methods, based on stress wave timing, radioactive radiation, or electrical resistivity have been used to detect decay in standing trees non-destructively. But apart from mobile gamma ray computed tomography (Habermehl and Ridder, 1993) which is virtually unavailable, the detection of incipient stages of decay is still not possible.
• Wood moisture and electrolyte content influence the electric resistivity of wood. Both are changed by fungal decay. Therefore electric resistivity tomography (ERT) should detect decay in its early stages. Then it could be used to monitor the spatial and temporal progress of degradation.
• We infected four Fraxinus excelsior trees with Trametes versicolor using wooden dowels and measured two-dimensional electric resistivity tomograms 3, 10, 13 and 21 months after infection. Immediately after the last electric resistivity measurement trees were felled for further analyses of stem cross-sections. Wood moisture content and raw density had significantly increased in infected areas, but dry density had not significantly changed after 21 months. Areas of very low electric resistivity around the infected wounds correlated very well with infected wood in the stem cross-sections. Increasing areas of low electric resistivity around the infected wounds during consecutive measurements indicate increasing areas of infected wood.
• We conclude that the growth of white rot by Trametes versicolor can be monitored with electric resistivity tomography (ERT) beginning from incipient stages, even before wood density decreases. ERT could therefore be a powerful research tool for decay dynamics as well as a method for diagnosing wood decay in forestry and arboriculture.
Résumé
• Le contrôle non destructif des champignons de la pourriture du bois dans les arbres vivants est pertinent pour la gestion forestière des essences précieuses, l’évaluation des risques de l’arbre, et la recherche en pathologie forestière. Une variété de méthodes de tomographie, sur la base d’onde de contraintes cadencées, des radiations radioactives, ou de la résistivité électrique ont été utilisés pour détecter la pourriture des arbres sur pied de façon non destructive. Mais, en dehors de la tomographie à rayon gamma mobile (Habermehl et Ridder, 1993) qui est pratiquement indisponible, la détection des débuts de pourriture n’est pas encore possible.
• L’humidité du bois et le contenu électrolytique influence la résistivité électrique du bois. Les deux sont modifiés par la pourriture fongique. Par conséquent, la tomographie de résistivité électrique (ERT) devrait détecter la pourriture à ses débuts. Ensuite, elle pourrait être utilisée pour surveiller les progrès de la dégradation dans l’espace et dans le temps.
• Nous avons infecté quatre Fraxinus excelsior avec Trametes versicolor à l’aide de chevilles de bois et mesuré les tomographies bi-dimentionnelles de résistivité électrique 3, 10, 13 et 21 mois après l’infection. Immédiatement après la dernière mesure de résistivité électrique les arbres ont été abattus pour faire d’autres analyses dans les sections transversales des troncs. La teneur en eau du bois et la densité des échantillons ont considérablement augmenté dans les zones infectées, mais la densité sèche n’a pas changé de manière significative après 21 mois. Les zones de très faible résistivité électrique autour des blessures infectées sont très bien corrélées avec le bois infecté dans les sections transversales du tronc. L’augmentation des zones de faible résistivité électrique, autour des blessures infectées, au cours des mesures consécutives, indique un accroissement des zones de bois infecté.
• Nous concluons que la croissance de la pourriture blanche de Trametes versicolor peut être contrôlée avec la tomographie de résistivité électrique (ERT) dès les premiers stades, avant même que la densité du bois diminue. ERT pourrait donc être un puissant outil de recherche pour étudier la dynamique d’évolution de la pourriture ainsi qu’une méthode de diagnostic de la pourriture du bois en foresterie et arboriculture.
Key words: development / ERT / monitoring / tomography / wood fungal decay
Mots clés : développement / ERT / contrôle / tomographie / pourriture fongique du bois
© INRA, EDP Sciences, 2010
1. INTRODUCTION
Fungal decay reduces the value and stability of trees and increases the risk of mechanical failure (Kucera and Niemz, 1998; Pearce, 2000; Rayner and Boddy, 1988; Schwarze, 2001). In most cases, tree safety is assessed from the fraction of decay in the stem cross-section (Wagener, 1963). The rate at which the decay advances is important for estimating the remaining safe lifetime of the tree. Depending on tree species and inoculated fungal species, fungal establishment and decay rates vary greatly, as was shown in several studies involving controlled wounding and inoculation of trees (Hirt, 1949; Münch, 1915; Shigo and Sharon, 1968; Silverborg, 1959; Smith, 2006).
Several tools are available for the measurement of wood decay in standing trees. Some of these methods (resistance to penetration, increment cores) are invasive and therefore assist further decay (Kersten and Schwarze, 2005; Kowol et al., 2001; Schwarze, 2008). They may produce different results depending on the direction of the one dimensional measurement. Today, non-destructive tomographic methods like electric resistivity tomography (ERT) (Rust et al., 2007; Weihs et al., 1999), sonic tomography (Rust, 2000), ultrasonic tomography (Nicolotti et al., 2003) and gamma ray computed tomography (Habermehl and Ridder, 1993; Habermehl et al., 1999; Rust, 1999) are available. They provide extensive information on decay for entire cross-sections of trees. Sonic tomography has been already in use for tree hazard assessment for some years.
Recent investigations have shown that sonic tomograms do not show early stages of wood fungal decay 28 months after infection, although the speed of sound was decreased significantly for some host/fungus combinations (Deflorio et al., 2008).
The objective of this study was to investigate whether the rather new ERT technology can be used for this purpose. Wood infected with decay fungi usually has different wood moisture contents than the uninfected wood and contains higher amounts of electrolytes (Tattar et al., 1972). Because moisture content and electrolytes have a strong influence on the electric properties of the material, its electric conductivity differs also (Skutt et al., 1972; Tattar and Blanchard, 1976). Therefore it should be possible to detect incipient stages of decay and to monitor the progress of rot in standing trees. Reliable non-destructive estimates of the extent and distribution of decay in living trees, even in initial stages, could provide a powerful method for the evaluation of tree stability and also for research in pathology.
2. MATERIALS AND METHODS
2.1. Experimental set-up
Fourteen dowels, 7 of them infected with Trametes versicolor (isolated in March 1991 (leg. et det.: R. Kehr) from white rot of ash (Fraxinus excelsior) tree growing near Königslutter, Germany. Grown on 2% MEA.) and 7 uninfected as controls, were placed in artificial wounds in 4 ash trees (Fraxinus excelsior) on July 28, 2005 in a forest near Göttingen, Germany (Tab. I). Wooden dowels made from beech (Fagus sylvatica L.) wood, 1 cm thick and 4 cm long, were dried to 60% water content, sterilized in an autoclave and infected with a pure culture of Trametes versicolor derived from a naturally infected ash (Fraxinus excelsior) tree under a clean bench. They were incubated in batches of five each in sterile Petri dishes sealed with Parafilm and kept at room temperature and diffuse daylight for 8 weeks before they were inserted into the trees in July 2005. Wounds 6 cm height and 4 cm wide were made at breast height (1.3 m above ground) at each of the four cardinal points on the stem of the trees using an oval metal mould which was pressed to the cambium. The bark was removed from the wound surface and a drill hole 40 mm deep and 11 mm thick was made in the middle of the wound. Two infected and two uninfected dowels per tree were inserted into these holes. Infected dowels were either placed at the north- and the south-facing wound or the west- and east facing wound. Due to its small diameter, one ash had only two wounds and therefore one infected and one uninfected dowel at opposing cardinal points.
Fraxinus excelsior infected with Trametes versicolor.
21 months after inoculation, the trees were felled and infection of the decayed area surrounding wounds with inoculated dowels was confirmed by re-isolation of Trametes versicolor. Neither incompatibility tests nor PCR were performed, because in many other experiments involving inoculation of wounds in ash by T. versicolor, white rot and, in particular, T. versicolor were never isolated from the control wounds. Thus it is very unlikely that the re-isolated T. versicolor would derive from a foreign isolate of T. versicolor which happened to infect wounds which had previously been supplied by dowels containing our isolate of T. versicolor.
Samples approx. 4 × 2mm were taken with a wood chisel from decayed wood on stem cross sections and surface-sterilized for 10 s. in 96% ethanol, blotted on sterile filter paper and transferred singly onto Petri dishes containing 2% malt extract agar. They were incubated at 20 °C in diffuse light and outgrowing colonies were subcultured and identified.
2.2. Electric resistivity tomography
Electrical resistivity is a measure of the degree to which an object opposes an electric
current through it, expressed in Ohms (Ω). Assuming a uniform current
density, an object’s electrical resistance is a function of both its physical geometry and
the resistivity of the material it is made of:  R = electrical resistivity in
Ω, l = length in m, A = Cross
sectional area in m2, ρ = electrical resistivity in
Ω m.
R = electrical resistivity in
Ω, l = length in m, A = Cross
sectional area in m2, ρ = electrical resistivity in
Ω m.
ERT is a method to determine the spatial distribution of electric resistivity non-destructively. The electrical resistivity or its reciprocal, the electrical conductivity, are physical properties that relate to the structure of objects. Originally ERT is a geophysical method for investigating sub-surface structures by using electrical measurements made on the surface. In 1998, ERT technology was introduced on standing trees (Just and Jacobs, 1998). They used geophysical instruments and adapted the mathematical algorithms to trees. In the following years ERT was applied to find discoloured wood (Weihs, 2001) and decay in trees (Dubbel et al., 1999; Rust et al., 2007). New reconstruction algorithms (Günther et al., 2006) have improved the result further by using the exact shape of the measuring level.
For the ERT measurements a multi-electrode multi-channel resistivity system (GEOTOMMK8E1000 RES/IP, GEOLOG Fuss/Hepp GbR) was used. This system was attached to the tree with 24 stainless steel needles which were arranged axial-symmetrically and at constant height above ground around the tree. Each needle had a diameter of 2 mm and was forced through bark and cambium to the outermost wood. The position of the electrodes was measured after the trees were felled and accounted for in the tomography. The injury to the tree by the electrodes is marginal so that the measurement can be considered as non-destructive. A low frequency current (8.3 Hz) was applied to measure apparent electric resistivities in dipole-dipole configuration (Reynolds, 1997). The software DC2dTree (Günther et al., 2006) was used for tomographic inversion. The colours in the tomogram represent the 2-dimensional distribution of electric resistivity in Ωm where blue shows the lowest and red the highest electric resistivities measured. The x- and y-axes of the tomogram indicate the dimension of the stem slice in metre. The entire process including the tomographic inversion is completed within 20 min per measurement.
All trees were measured with ERT 3, 10, 13 and 21 months after the infection, except for tree No. 2 which was only measured after 4 and 21 months. The measurements of electric resistivity were made slightly above the wounds. 21 months after the infection additional measurements were made up to ± 40 cm above and below the wounds in 10 cm steps.
2.3. Wood moisture content and analysis of tomograms
Trees were felled 21 months after infection and stem cross-sections cut in the plane of the tomography were photographed. Afterwards the stem slices were cut vertically to analyse the vertical extend of the decay.
For the analysis of the moisture content 7 stem slices of tree No. 2 were cut into small
samples and dried at 103 ± 2 °C until constant mass was reached. The moisture content
(u) is calculated as:  u = moisture content,
Wg= Weight of green wood, Wd=
Weight of oven dry wood.
u = moisture content,
Wg= Weight of green wood, Wd=
Weight of oven dry wood.
In Fraxinus excelsior, low resistivities are usually measured in sapwood and areas of increased wood moisture content, whereas heartwood and advanced decay increase resistivities. Thus, for quantitative comparisons between tomograms and cross-sections, areas of very low electric resistivity around the infected wounds with a steep gradient to the surrounding material were assumed to be infected and their area measured with ImageJ (Rasband, 2008). This software was also used to measure the size of areas of decayed wood in photos of the stem cross-sections.
Correlation of electric resistivities in the tomograms with wood moisture content, raw density and dry density were analysed for seven cross-sections. To analyse the fungal growth rate, changes of resistivity patterns in the tomograms were studied over the whole time period. Statistical analyses were performed with R (R Development Core Team 2008).
3. RESULTS
3.1. Pattern of decay in stem slices compared to tomograms
Trametes versicolor was re-isolated from the decay zones resulting from inoculated dowels in all trees, but tree No. 4 was discarded from further analysis because just a very marginal decay zone had formed. In the other trees decay extended from the cambium to the stem centre and vertically more than 20 cm above and below the dowels. Areas around uninfected dowels showed either just discolouration or very marginal decay. The tomograms made before tree harvest showed a strong pattern in the electric resistivity. By far the lowest electric resistivities were found around the infected wounds. These areas of low electric resistivity decreased axially with increasing distance to the infection wound as the amount of decayed wood did. Around the uninfected dowels electric resistivity was also changed but these areas were considerably smaller, as was the area of discolouration/decay, and the absolute resistivities were also not as low as in the areas of infected dowels (Fig. 1).
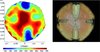 |
Figure 1 Tomogram and stem cross-section of tree No. 3, 21 months after infection with Trametes versicolor. (A colour version of this figure is available at www.afsjournal.org.) |
Areas of very low electric resistivity around the wounds measured at 7 heights above and below the infection level compared well with the areas of decayed wood for each slice (R2 > 0.77; p < 0.0001) 21 months after the infection (Fig. 2).
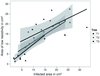 |
Figure 2 Area of low electrical resistivity against area infected by decay as detected visually in photos of stem cross-sections. |
The samples of decayed wood showed a significantly higher moisture content (54.0% s.e. ± 1.6%) than samples of undecayed wood (44.7% s.e. ± 1.0%, Figure 3, R2 = 0.79, p = 0.002). Mean raw density of decayed wood (0.93 s.e. ± 0.01) had increased by 6.4% (s.e. ± 0.7%, p < 0.0001), but dry density did not differ (0.58 s.e. ± 0.006 compared to 0.61 s.e. ± 0.006, p = 0.28). Apparently non infected sapwood had only a slightly higher mean moisture content than heartwood (p < 0.0001). The correlation between moisture content and electric resistivity was high (R2 = 0.72). In apparently non-infected samples, heartwood had almost twice the resistivity than sapwood when compared at the same level of moisture content (p < 0.0001).
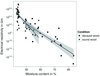 |
Figure 3 Electrical resistivity of tree No. 2 fell with increasing wood moisture content, which was significantly higher in decaying wood (R2 = 0.79, p = 0.002). |
3.2. Development of decay
Three months after the infection small areas of relatively low electric resistivity could already be detected around the points of infection. These grew continuously during the experiment (Figs. 4 and 5).
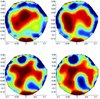 |
Figure 4 Tomograms of tree No. 3 made 10 cm above the dowels 3 (upper left), 10, 13 and 21 (lower right) month after infection with Trametes versicolor. Areas of low electric resistivity indicate increasing areas of infected wood. (A colour version of this figure is available at www.afsjournal.org.) |
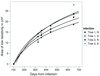 |
Figure
5 Areas of very low electric resistivity around the infected wounds of trees Nos. 1 and 3 measured 3, 10, 13 and 21 month after infection. Lines indicate results from a mixed effects model. |
The wood around the uninfected dowels showed just very small or no area of low electric resistivity, which is in agreement with the fact that around most dowels only limited discolouration took place and nearly no decay could be detected after cutting.
4. DISCUSSION
Apparently the areas of very low electric resistivity in the tomograms were highly correlated with decay. This is mainly due to the fact that in most types of decayed wood moisture content (Fig. 3) and electrolyte concentrations are higher than in the surrounding uninfected wood (Tattar and Blanchard, 1976). Both of these attributes lead to a significant increase of electric conductivity. This relationship has been well known for some time (Dixon et al., 1978; Lin, 1967; Shigo and Shigo, 1974). In our study we found a high correlation between areas of relatively low electric resistivity around the infected wounds and the fungal decay in the stem slice (Fig. 2). When compared within a specific stem cross-section, the areas of very low electric resistivity will not fit perfectly because the electric resistivity measured in a specific plane will always be influenced by the surrounding volume of wood. This influence on the ERT decreases with distance from the measured plane but should always be considered in the interpretation of the tomograms. From our study we conclude that if the extent of decay decreases axially from the plane of measurement, ERT will underestimate the area of decay. When the area of decay increases axially from the plane of measurement, ERT will overestimate the affected area.
Because the last tomograms taken before cutting the trees fit well with the visually detected fungal decay in the cross-sections we concluded that it is possible to monitor the fungal growth by following the development of low resistivity areas in the tomograms around the infected wounds (Fig. 5).
Because small changes in water content and/or amounts of electrolytes lead to a significant increase of electric conductivity even before dry density decreases, it is possible to detect decay in its early stages and to map incipient stages of fungal decay with continuous measurements.
Compared to ERT, older tools for measuring electric resistivity of trees like the Shigometer, Conditiometer AS and the Vitamat had the decisive disadvantages that they provide information for just a specific point or along a path, but could not show the 2-dimensional resistivity pattern of the entire cross-section. Additionally they are destructive because electrodes need to be pushed deeply into the woody tissue or even holes need to be drilled for electrode insertion when decay is to be detected (Nicolotti and Miglietta, 1998). Therefore these instruments cannot be used to monitor the progress of decay without affecting the tree.
Mobile gamma ray computed tomography (Habermehl et al., 1986; Rust, 1999), although potentially being able to detect incipient decay and giving higher resolution tomograms, is no alternative, because of its restrictions due to the use of radioactive radiation, prohibitive costs, and time consuming measurements.
Even though later stages of wood decay can be displayed accurately by sonic tomography (Rust, 2000), early stages often go undetected because sound velocity is not reduced sufficiently to show any changes in the tomogram (Deflorio et al., 2008).
Previous publications have shown that advanced decay, sap flow, discolouration of wood and heartwood of different tree species can be detected with electric resistivity tomography (Hagrey, 2006; 2007; Rust et al., 2007; Weihs et al., 1999). Our results show that even early stages of decay decrease the electric resistivity of wood and can be detected with ERT. Noticeable changes in electric conductivity were detected as early as four months after infection in those wounds infected by T. versicolor, indicating that the tree reacts differently to infection by pathogens than to the “normal”succession of fungi and other micro-organisms (Shigo, 1967) in pathogen-free control wounds. This is in agreement with other studies, which, however, used destructive methods for analysing the progress of decay and discolouration (Shortle et al., 1995). Thus the method could be used to monitor changes following inoculation with decay fungi non-destructively.
The method might have limits in cases where the electrical resistivity of healthy wood is in the same range as in infected wood. As an example, this might occur when heartwood of conifers, which usually has high electrical resistivities in comparison to the surrounding sapwood, is infected with a pathogen and therefore electrical resistivity increases to values comparable to those of healthy sapwood. This could mask incipient decay at the edge of the heartwood. Although most types of wood fungal decay increase the wood moisture content and amounts of electrolytes there are some types that actively dry out the wood. The influence of these fungi on the electrical resistivity has not been studied yet and should be emphasized for future work. Further investigations are also needed to specify the applicability of ERT for different host/fungus combinations.
Our results show that ERT is a very promising tool for studying the growth of decay fungi in living trees and also for the continuous monitoring of decay progress to assess the stability of trees.
References
- Deflorio G., Fink S. and Schwarze F.W.M.R., 2008. Detection of incipient decay in tree stems with sonic tomography after wounding and fungal inoculation. Wood Sci. Technol. 42: 117–132 [CrossRef] [Google Scholar]
- Dixon M.A., Thompson R.G. and Fensom D.S., 1978. Electrical resistance measurements of water potential in avocado and white spruce. Can. J. For. Res. 8: 73–80 [CrossRef] [Google Scholar]
- Dubbel V., Weihs U., Krummheuer F. and Just A., 1999. Neue Methode zu 2-dimensionalen Darstellung von Fäulen an Fichte. AFZ, Der Wald. 26: 1422–1425. [Google Scholar]
- Günther T., Rücker C. and Spitzer K., 2006. 3-d modeling and inversion of DC resistivity data incorporating topography – Part II: Inversion. Geophys. J. Int. 166: 506–517 [CrossRef] [Google Scholar]
- Habermehl A., Ridder H.W. and Schmidt S., 1986. Mobiles Computer-Tomographie-Gerät zur Untersuchung ortsfester Objekte. Atomenergie, Kerntechnik 48: 94–99. [Google Scholar]
- Habermehl A. and Ridder F., 1993. Application of computed-tomography for non-destroying investigations on wood of living trees – Forestry studies. Holz Roh Werkst. 51: 1–6 [CrossRef] [Google Scholar]
- Habermehl A., Ridder H.W. and Seidl P., 1999. Computerized tomographic systems as tools for diagnosing urban tree health. Acta Hortic. 496: 261–268 [Google Scholar]
- Hagrey al S.A., 2006. Electrical resistivity imaging of tree trunks. Near Surface Geophys. 4: 179–187 [Google Scholar]
- Hagrey al S.A., 2007. Geophysical imaging of root-zone, trunk, and moisture heterogeneity. J. Exp. Bot. 58: 1–16 [Google Scholar]
- Hirt R.R., 1949. Decay of certain northern hardwoods by Fomes igniarius, Poria obliqua, and Polyporus glomeratus. Phytopathology 34: 475–480 [Google Scholar]
- Just A. and Jacobs F., 1998. Elektrische Widerstandstomographie zur Untersuchung des Gesundheitszustandes von Bäumen. Tagungsband des VII. Arbeitsseminars “Hochauflösende Geoelektrik”Institut für Geophysik und Geologie der Universität Leipzig. [Google Scholar]
- Kersten W. and Schwarze F.W.M.R., 2005. Development of decay in the sapwood of trees wounded by the use of decay-detecting techniques. Arboric. J. 28: 151–164 [Google Scholar]
- Kowol T., Kehr R., Wohlers A. and Dujesiefken D., 2001: Wundreaktionen und Pilzbefall im Holzkörper nach Resistograph- und Zuwachsbohrer-Einsatz zur Baumuntersuchung im Bereich von Fäulen. In: Dujesiefken D. and Kockerbeck P. (Eds.), Jahrbuch der Baumpflege. Thalacker Verlag, Braunschweig, pp. 203–211. [Google Scholar]
- Kucera L.J. and Niemz P., 1998. Fäule in Bäumen erkennen. Wald Holz 2: 27–30 [Google Scholar]
- Lin R.T., 1967. Review of the Electrical properties of wood and cellulose. For. Prod. J. 17: 54–60 [Google Scholar]
- Münch E., 1915. Untersuchungen über Eichenkrankheiten. Naturw. Ztschr. Forst u. Land. 13: 509–522 [Google Scholar]
- Nicolotti G. and Miglietta P., 1998. Using high technology instruments to assess defects in trees. J. Arboric. 24: 297–302 [Google Scholar]
- Nicolotti G., Socco L.V., Martinis R., Godio A. and Sambuelli L., 2003. Application and comparison of three tomographic techniques for detection of decay in trees. J. Arboric. 29: 66–78 [Google Scholar]
- Pearce R.B., 2000. Decay development and its restriction in trees. J. Arboric. 26: 1–11 [Google Scholar]
- R 2008. A Language and Environment for Statistical Computing. R development core team, Vienna, Austria. ISBN 3-900051-07-0, URL http://www.Rproject.org. [Google Scholar]
- Rasband W.S., 2008. ImageJ, US National Institutes of Health, Bethesda,Maryland, USA, http://rsb.info.nih.gov/ij. [Google Scholar]
- Rayner A.D.M. and Boddy L., 1988. Fungal decomposition of wood. John Wiley and Sons, Chichester, UK. [Google Scholar]
- Reynolds J.M., 1997. An Introduction to Applied and Environmental Geophysics. John Wiley & Sons, West Sussex, UK, 796 p. [Google Scholar]
- Rust S., 1999. Comparison of three Methods for determining the conductive xylem area of Scots pine (Pinus sylvestris L.). Forestry 72: 103–108 [CrossRef] [Google Scholar]
- Rust S., 2000. A new tomographic device for the non-destructive testing of standing trees. Proceedings of the 12th International Symposium on Nondestructive Testing of Wood. University of Western Hungary, Sopron, pp. 233–238. [Google Scholar]
- Rust S., Weihs U. and Bieker D., 2007. Zerstörungsfreie Baumdiagnose mittels elektrischer Widerstandstomographie. AFZ/Der Wald 62: 400–403 [Google Scholar]
- Schwarze F.W.M.R., 2001. Development and prognosis of decay in the sapwood of living trees. Arboric. J. 25: 321–337 [Google Scholar]
- Schwarze F.W.M.R., 2008. Diagnosis and prognosis of the development of wood decay in urban trees. ENSPEC, Rowville, 336 p. [Google Scholar]
- Shigo A.L., 1967. Successions of organisms in discolouration and decay of wood. Int. Rev. For. Res. 2: 237–299 [Google Scholar]
- Shigo A.L. and Sharon E.M., 1968. Discolouration and decay in hardwoods following inoculations with Hymenomycetes. Phytopath, 58: 1493–1498. [Google Scholar]
- Shigo A.L. and Shigo A., 1974. Detection of discolouration and decay in living trees and utility poles. USDA For. Serv. Res. Paper NE-294. [Google Scholar]
- Shortle W.C., Smith K.T., Dudzik K.R. and Parker S., 1995. Response of maple sapwood to injury and infection. Eur. J. For. Pathol. 25: 241–252 [CrossRef] [Google Scholar]
- Silverborg S.B., 1959. Rate of decay in Northern hardwoods following artificial inoculation with some common heartrot fungi. For. Sci. 5: 223–228 [Google Scholar]
- Skutt H.R., Shigo A.L. and Lessard R.A., 1972. Detection of discoloured and decayed wood in living trees using a pulsed electric current. Can. J. For. Res. 2: 54–56 [CrossRef] [Google Scholar]
- Smith K.T., 2006, Compartmentalization today. Arboric. J. 29: 173–184. [Google Scholar]
- Tattar T.A., Shigo A.L. and Chase T., 1972. Relationship between the degree of resistance to a pulsed electric current and wood in progressive stages of discoloration and decay in living trees. Can. J. For. Res. 2: 236–243 [CrossRef] [Google Scholar]
- Tattar T.A. and Blanchard R.O., 1976. Electrophysiological research in plant physiology. Annu. Rev. Phytopathol. 14: 309–325 [CrossRef] [Google Scholar]
- Wagener W.W., 1963. Judging hazards from native trees in California recreational areas. USDA Forest Service PSW-P1. [Google Scholar]
- Weihs and U., 2001. Farbkerndiagnose am stehenden Elsbeerenstamm. AFZ/Der Wald 6: 268-270 [Google Scholar]
- Weihs U., Dubbel V., Krummheuer F. and Just A., 1999. Die elektrische Widerstandstomographie – Ein vielversprechendes Verfahren zur Farbkerndiagnose an stehenden Rotbuchen. Forst. Holz 6: 166–170 [Google Scholar]
All Tables
All Figures
|
Figure 1 Tomogram and stem cross-section of tree No. 3, 21 months after infection with Trametes versicolor. (A colour version of this figure is available at www.afsjournal.org.) |
| In the text | |
|
Figure 2 Area of low electrical resistivity against area infected by decay as detected visually in photos of stem cross-sections. |
| In the text | |
|
Figure 3 Electrical resistivity of tree No. 2 fell with increasing wood moisture content, which was significantly higher in decaying wood (R2 = 0.79, p = 0.002). |
| In the text | |
|
Figure 4 Tomograms of tree No. 3 made 10 cm above the dowels 3 (upper left), 10, 13 and 21 (lower right) month after infection with Trametes versicolor. Areas of low electric resistivity indicate increasing areas of infected wood. (A colour version of this figure is available at www.afsjournal.org.) |
| In the text | |
|
Figure
5 Areas of very low electric resistivity around the infected wounds of trees Nos. 1 and 3 measured 3, 10, 13 and 21 month after infection. Lines indicate results from a mixed effects model. |
| In the text | |