Free Access
Figure 3
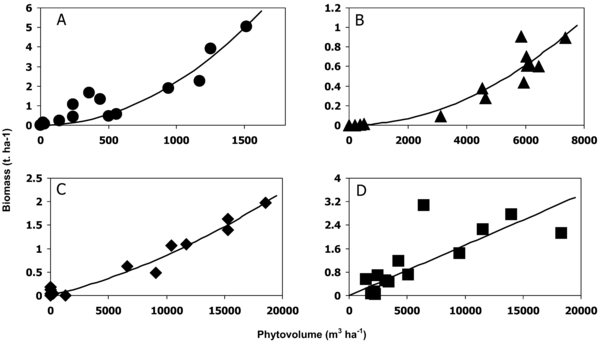
Relationship between the biomass (t DM ha-1) and the phytovolume (m3 ha-1). Each point corresponds to the stand estimate per species group (A) Mosses (B) Herbaceous species (C) Bracken (D) Woody species. The full lines present the models based on the 11 class measurements (Tab. II).