Free Access
Figure 2
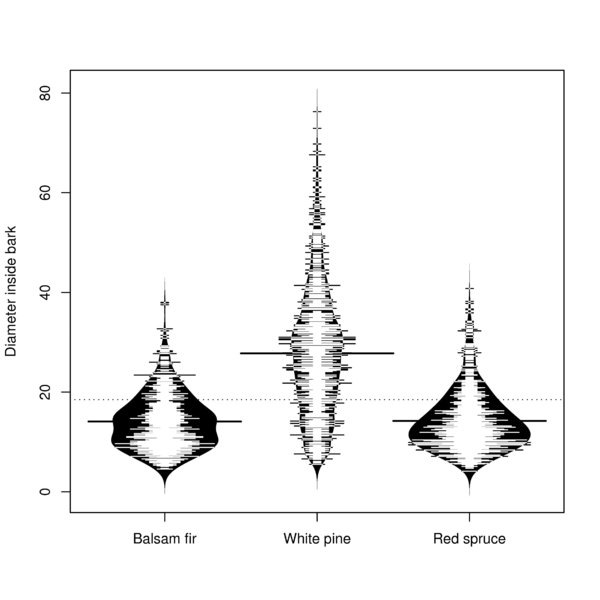
Bean plots for diameter inside bark balsam fir, red spruce, and white pine. The dotted line is the mean dib across species, while the black solid line is the mean for each individual species. The length of white horizontal bars represent the number of observations for a certain dib.