Free Access
Figure 2
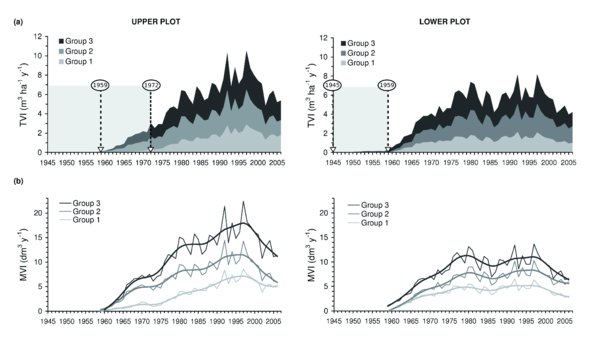
(a) Stand Total volume increment (TVI) as the sum of the three basal area groups total volume increment (TVIg) and (b) Mean Volume Increment (MVIg) for each basal area group. Thick lines are 11-y cubic smoothing splines. The vertical arrows show the year of coppicing in each plot.