Free Access
Figure 4
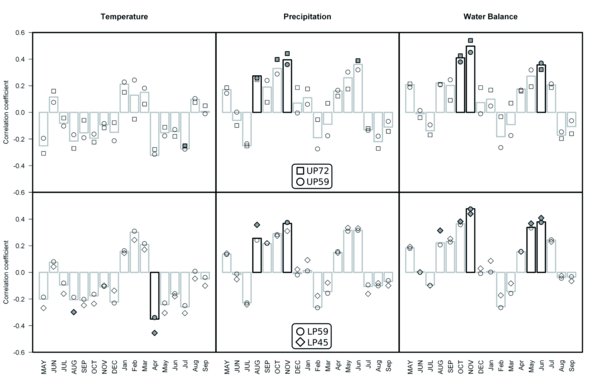
Correlation functions between mean volume increment chronologies of all trees in the study plot (bars) or for each cohort (circles) and monthly climatic variables for the period 1974–2006. Thicker bar borders and grey symbols show bootstrap correlations with p < 0.05. UP: upper plot; LP: lower plot. Uppercase months on x-axis refer to the year preceding growth.