Free Access
Figure 5
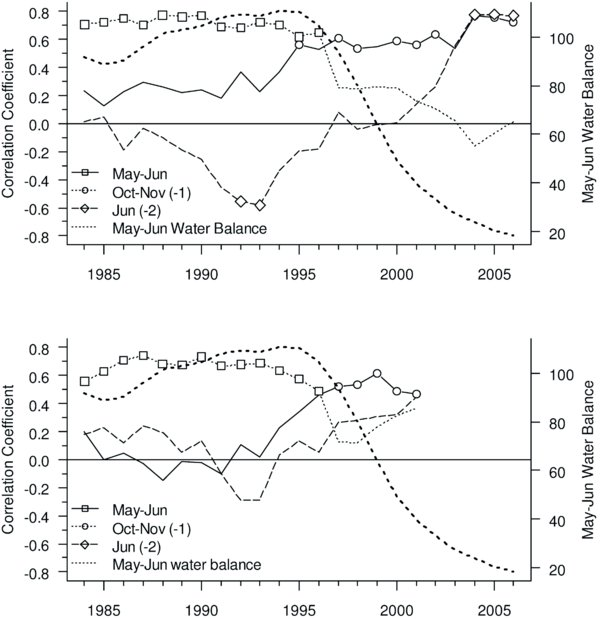
11-y Moving Correlation Function (MCF) of LP59 volume increment (above) and the BAI of Quercus cerris from the Manziana high-forest (below) with selected climatic factors. Each value represent the last year of each interval. Symbols upon each line denote 11-y intervals with bootstrap correlation p < 0.05. Dotted line: May–June water balance 11-y spline.