Free Access
Figure 6
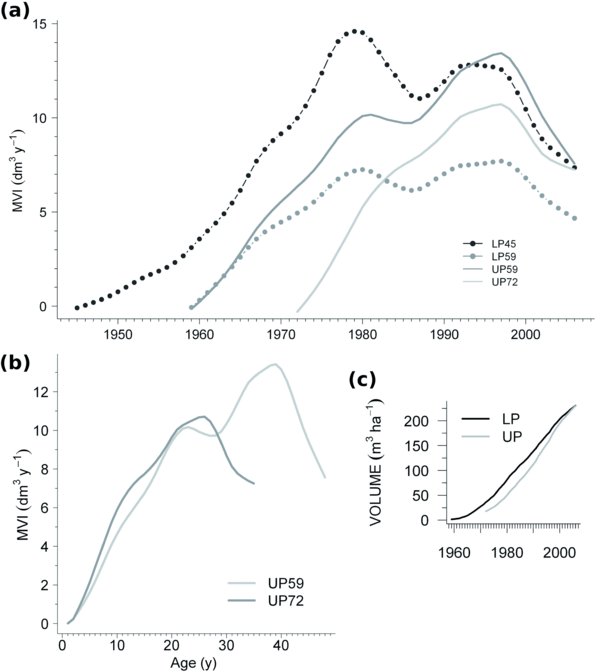
Mean volume increment (MVI) 11-y splines of (a) all cohorts as a function of time and (b) upper plot cohorts as a function of age (c) cumulated total volume increment since the last logging at upper (grey) and lower (black) plot.