Free Access
Figure 7
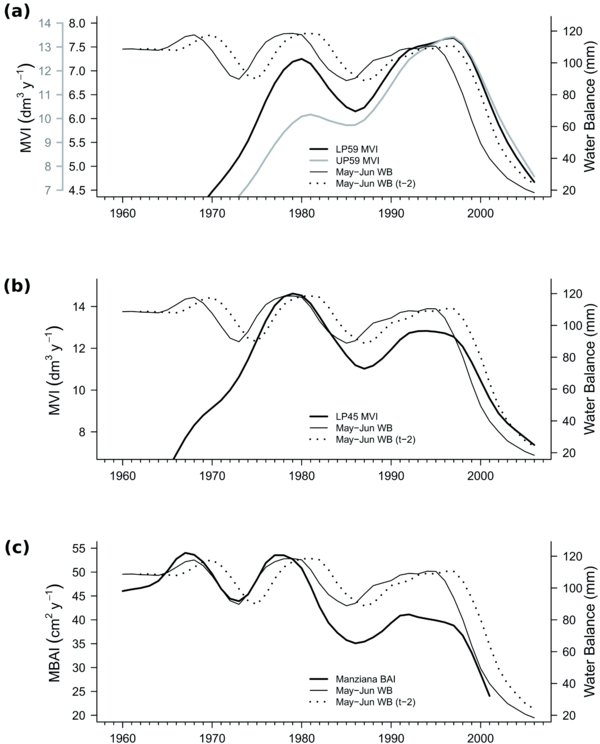
11-y splines of the mean volume increment (MVI) or mean basal area increment (MBAI) matched to May–June water balance (WB) of current year (t) and 2 years before present (t−2). (a) Lower and upper plot 1959 cohort (LP59, UP59); the gray y-axis refers to UP59. (b) Lower plot 1945 cohort (LP45). (c) Mean BAI of Manziana Quercus cerris high-forest.