Free Access
Figure 2
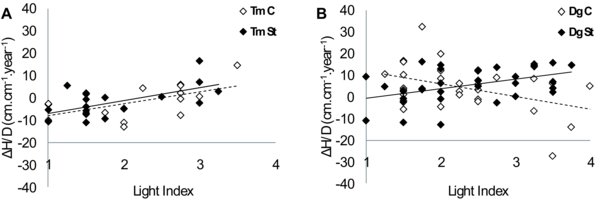
Slenderness variations according to the light index for T. melinonii (A) and D. guianensis (B). The linear regressions curves (see Tab. II) are represented by dotted lines for control saplings and continuous lines for staked saplings.