Free Access
Figure 3
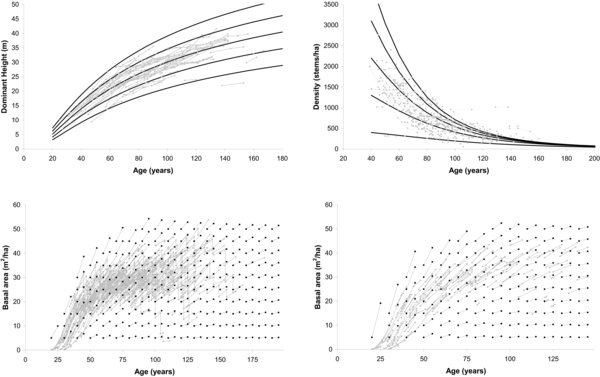
Upper left: dominant height curves for site indices of 18, 22, 26, 30 and 34 m at a reference age of 80 years for the GADA equation E1. Upper right: reduction in tree number curves for 400, 300, 2 200, 3 100, 4 000 trees per ha at a reference age of 40 years for the model (E5). Down: basal area growth rates for thinned (left) and unthinned stands (right) as affected by initial stem number and age overlaid on the trajectories of basal area.