| Issue |
Ann. For. Sci.
Volume 67, Number 8, December 2010
|
|
|---|---|---|
| Article Number | 805 | |
| Number of page(s) | 11 | |
| Section | Original articles | |
| DOI | https://doi.org/10.1051/forest/2010041 | |
| Published online | 07 October 2010 | |
Online material
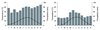 |
Figure S1
Climate diagrams for the Speulderbos (NL) (left) and Freienwalde (GER) (right). The bars represent monthly mean precipitation and the lines monthly mean temperature for the period 1958–2002. |
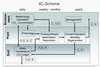 |
Figure S2
Scheme of the 4C model adapted from Kint et al. (2009). Further model description in Section 2.2. |
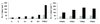 |
Figure S3
Mean annual number of days where tree water demand exceeds soil water supply for the Speulderbos (left) and Freienwalde (right). Black bars for Douglas-fir and grey bars for beech. The scenario realisation codes are explained in Table III. |
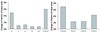 |
Figure S4
Change in proportion of basal area covered by beech in relation to the initialised proportion for the Speulderbos (left) and Freienwalde (right). |
© INRA, EDP Sciences, 2010