Free Access
Figure 3
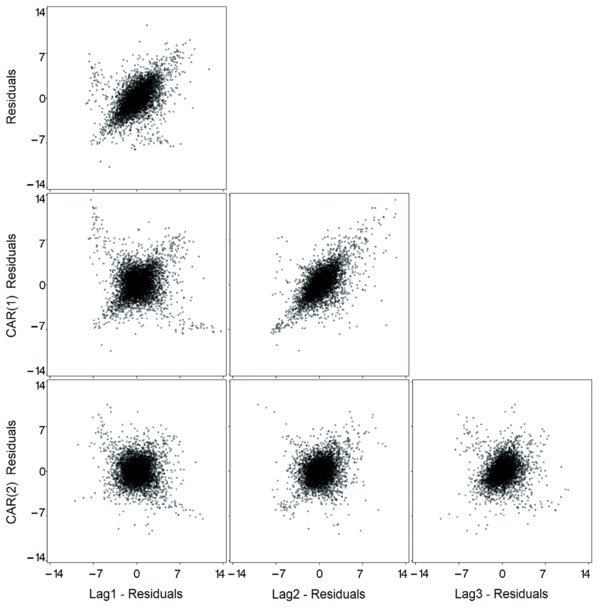
An example, for mountain range 2, of d residuals plotted against: Lag1-residuals (left column), Lag2-residuals (middle column), and Lag3-residuals (right column) for the model of Fang et al. (2000) fitted without considering the autocorrelation parameters (first row), and with continuous autoregressive error structures of first and second order (second and third rows, respectively).