Free Access
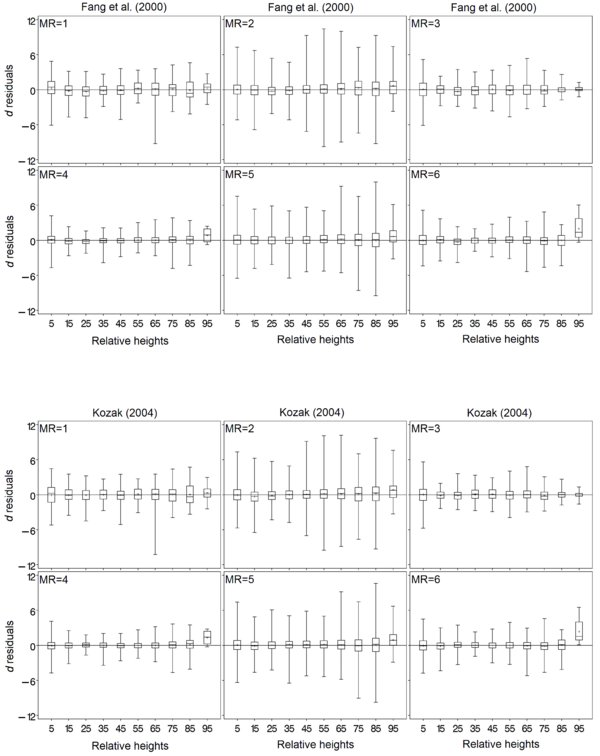
Figure 4

Box plots of d residuals (Y-axis, cm) against relative height classes (X-axis, in percent) for the different models and mountain ranges. The plus signs represent the mean of prediction errors for the corresponding relative height classes. The boxes represent the interquartile ranges. The maximum and minimum diameter over bark prediction errors are represented respectively by the upper and lower small horizontal lines crossing the vertical lines.


